HelpMeViz

Where in the World Are You Invested?

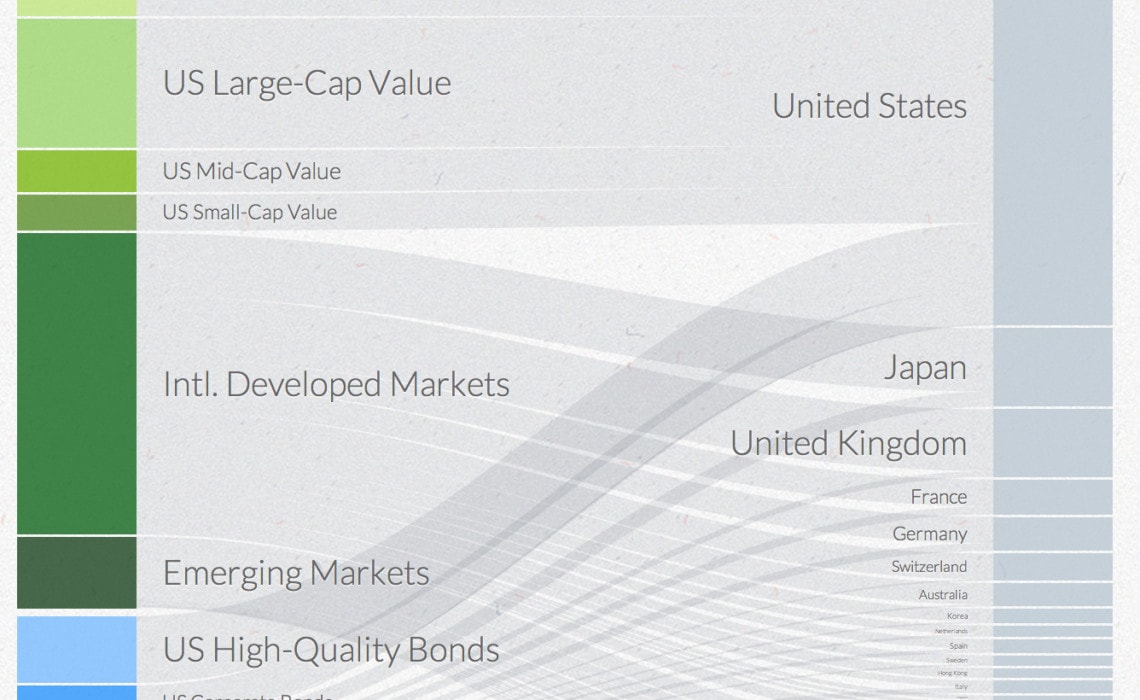
Joe sent in this request earlier today: I’d love some feedback on a viz that was just posted here: https://www.betterment.com/blog/2014/03/19/portfolio-diversification/ My challenge is to visually communicate a data set (available in csv format here) with a lot of possible combinations (12…

Continue reading

Visualizing YouTube Analytics

Hi! My name is Julie, and I need help visualizing some YouTube channel analytics data over time. Attached is the spreadsheet I’m working on as well as quick mock-up in Paint of what I’d like the graph to look like. On…

Continue reading

Happy Pi Day!

In case you’re not aware, today is March 14, 2014—3/14/14—better known as Pi Day.  For some, this is probably an excuse to eat a lot of pie and for others it’s probably an excuse to memorize some number of digits…

Continue reading

Tax Scatterplot

From Howard Chernick (Hunter College and the Graduate Center, CUNY), Cordelia Reimers (Hunter College, CUNY), and Jennifer Tennant (Ithaca College): This is a scatter of the actual change in state tax revenue, 2007-2009, per number of federal returns, against a…

Continue reading

Trying to Excel at Excel

I am trying to create an Excel column chart that displays a ‘Target’ column and an ‘Actual’ column by month. I would like the ‘Target’ column to always show on the chart in blue and next to it (right) I…

Continue reading

Cost-Import Scatterplot

The following request comes from an economics book publisher. The existing figure is a scatterplot (originally constructed in Stata) with nearly 56,000 data points (csv file here). Ideally, the graph would follow the publisher’s basic style: Times New Roman font;…

Continue reading

Have Data, Will Visualize

This submission is a first for HelpMeViz. A foundation sent in their data and need help visualizing the data. Have fun. This spreadsheet summarizes the 300 grants awarded by our foundation in the past year. It includes the type of grant…

Continue reading

Maps – At a Loss

Michael Taylor from ColdWater Economics writes in the following: Dear HelpMeViz, I wonder if you could give me some pointers. I am an economist, and my particular speciality is tracking global data. For this exercise, I am following approximately 400…

Continue reading
Close