Search Results

excel

Table Design Help

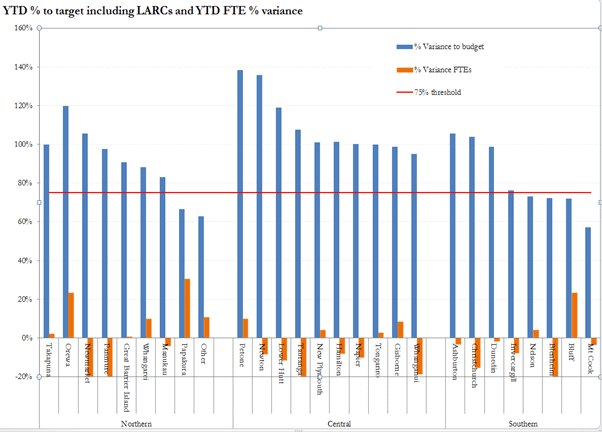
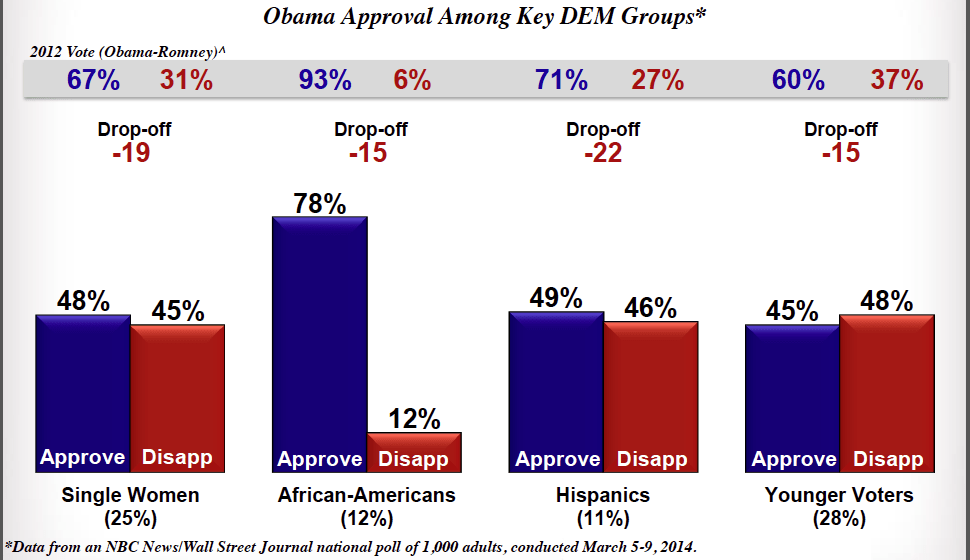
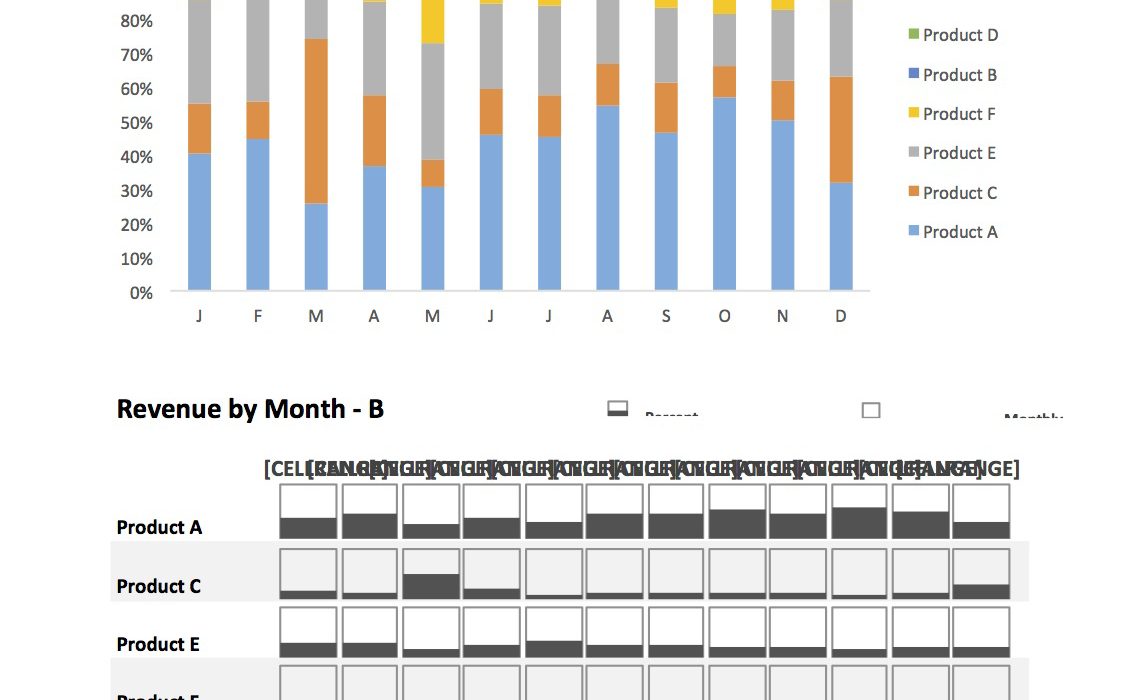
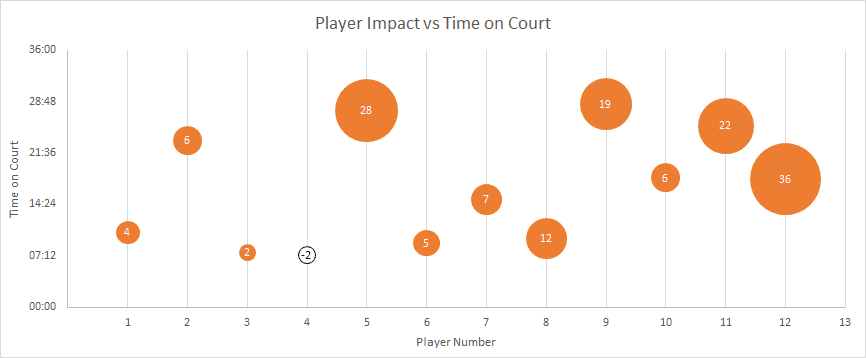
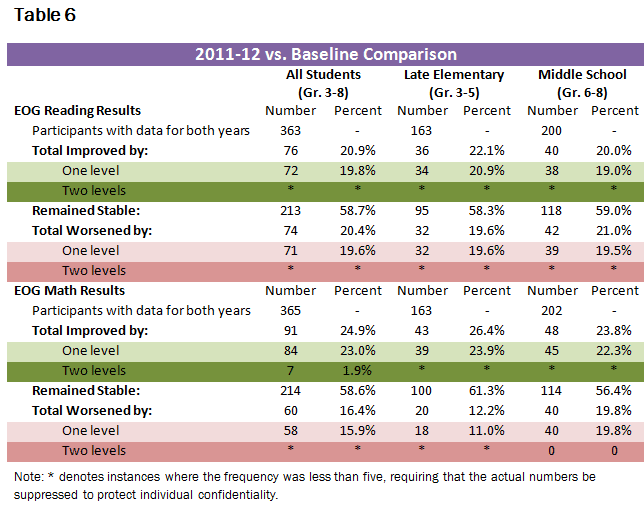
Hi, We’ve been struggling with how to make this table reader friendly for the non-data literate.  Please help!  This table is included in a larger report that will be distributed to community agencies with varying levels of data literacy. Please…

Continue reading

Percentages and Targets

This request for help comes from Mike Clark. I am aiming to compare two categories (both in percentage), one of which can and does have negative values for particular locations, and then grouped into regions. There is also a 75%…

Continue reading

Income Volatility Line Graphs

Bradley Hardy from American University sends in the following request: I’m trying to figure out how to create “nice” panel charts in excel, where I’m currently attempting to do so in Stata. (See for example Figure 2.) I can easily…

Continue reading

Trying to Fix “The Fix”

Over on PolicyViz, I wrote a post about this graph from The Fix at the Washington Post. I’m not a fan of the graph namely because the focus of the article was about the change in approval ratings between 2012…

Continue reading

Part-to-Whole Help

Reader and contributor Ulrik Willemoes writes in the following request for Excel help. I am looking for some feedback on a rather basic visualization. I wish to display a parts-to-whole relationship over time. I know stacked bars or areas do not…

Continue reading

Charting Player Impact vs Time on Court

Over on PolicyViz.com, Mynda Treacy from MyOnlineTrainingHub wrote a guest blog post about visualizing basketball data. Mynda writes about and teaches Excel skills, ranging from number formats to chart types to VBA code. In her PolicyViz post, Mynda walks through her…

Continue reading
Close