Excel T-shirt
July 3, 2023
Leave a comment
0
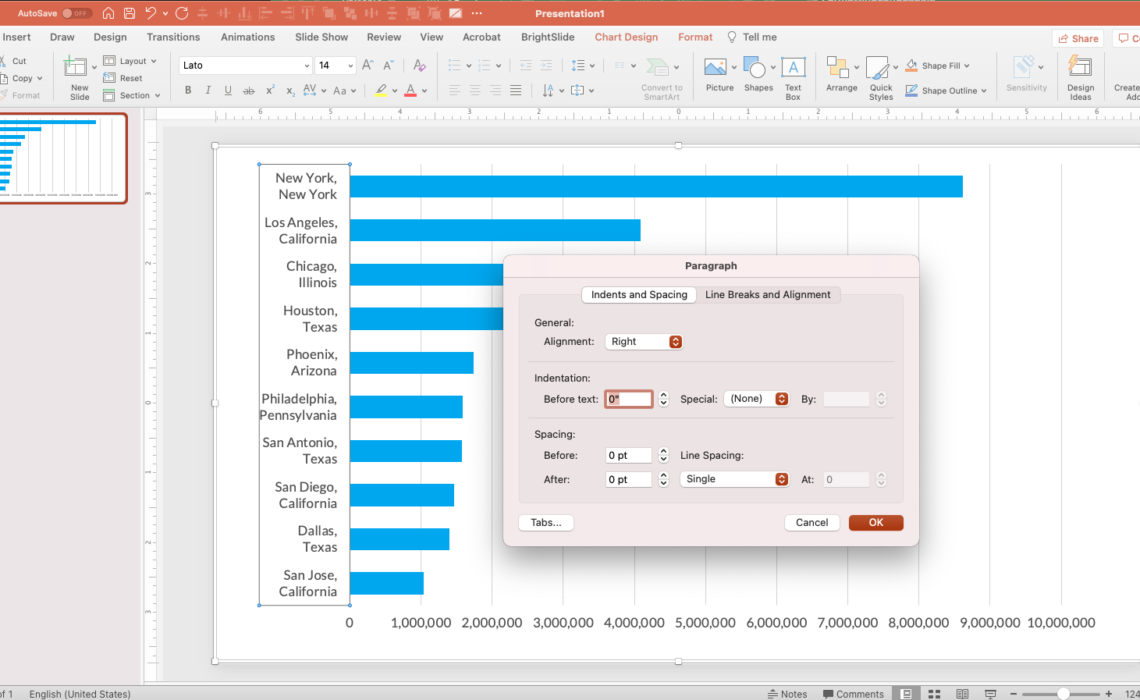
Whenever I’m teaching data visualization in Excel, the main thing I keep reminding people is, when in doubt, right-click. It will usually solve whatever dataviz problem you’re having.
Continue reading