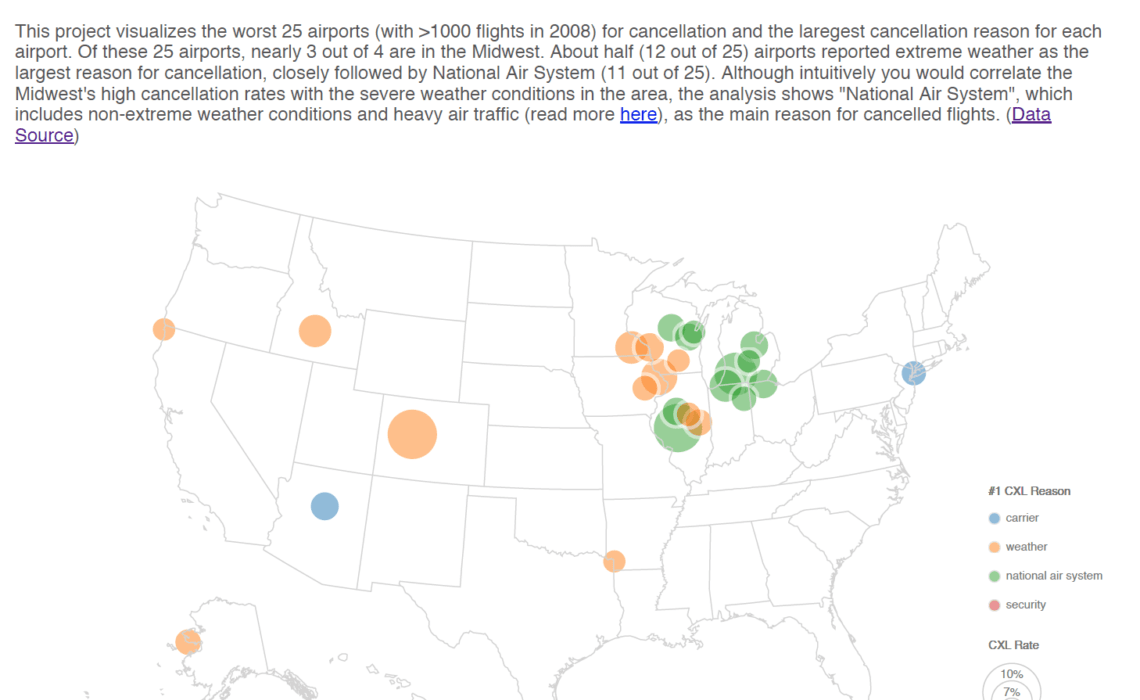
I am writing to request review on one of my first d3 visualizations. This project is a part of the capstone projects under the Udacity Data Analyst Program. One of the project requirements is to gather feedback from online community.
The first version of this project is too exploratory and didn’t meet the project requirements, so I tweaked the codes and made a second explanatory version. In particular, I would like feedback on the following questions:
- What do you notice in the visualization?
- What questions do you have about the data?
- Is there something you don’t understand in the visualization?
- Do you find any relationships interesting or counter-intuitive?
- What do you like about the visualization?
- What do you think I can improve on the visualization?
I’ve posted the interactive visualization here and the full project code and documentation on my Github page.
Any suggestions and comments are well appreciated in advance.


I made some changes as suggested by some Udacity peers. Instead o reporting on airports with worst cancellation rate, I visualized CXL rate of 25 busiest airports by number of flights in 2008. Here is the latest version:
I will update the link if I make further changes per online feedback. Thanks!