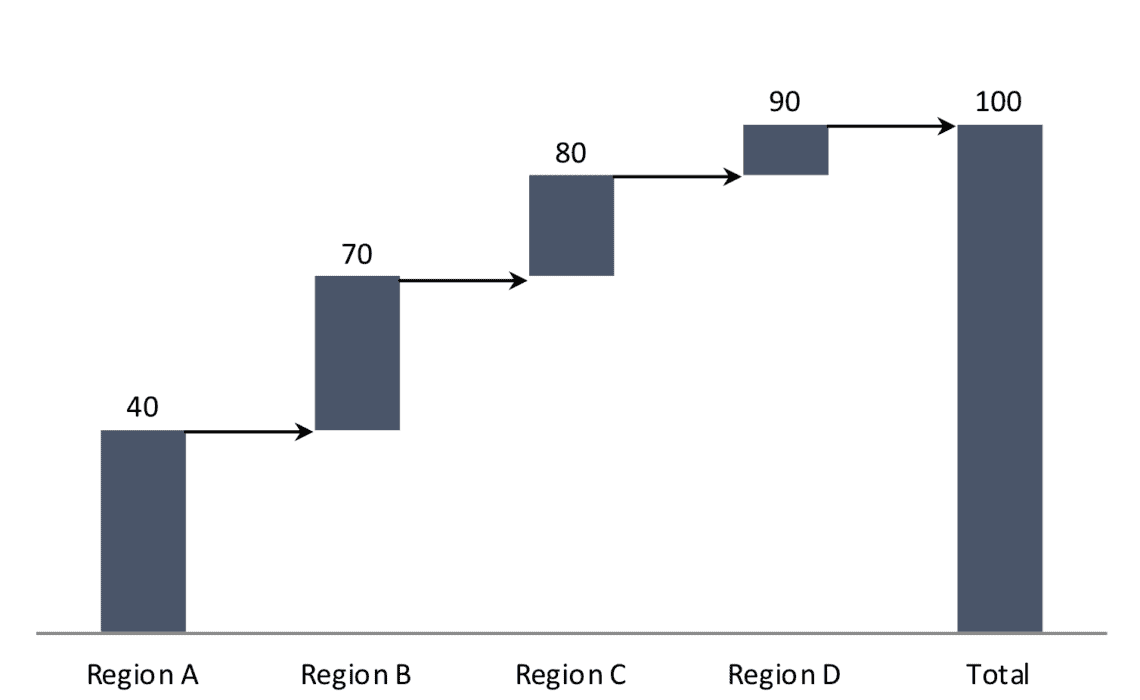
Tutorials

in Tutorials

Create a Gradient Plot in Excel

Communicating uncertainty is a difficult task. Many readers don’t fully appreciate or understand uncertainty, what it means, and where it comes from. A similar case can be made for visualizing distributions. I’ve heard many complaints about the good ol’ box-and-whisker…

Continue reading
in Tutorials

The Raincloud Plot

A few weeks ago, I published an Excel tutorial on how to create the ill-named “box-and-whisker-and-scatterplot chart.” In response, Len Kiefer pointed me to a post on Maarten Lambrecht’s cool new project Xenographics that was essentially the same chart type, just…

Continue reading
Close