Redesign: Making a Mosaic Chart
October 15, 2020
1 Comment
5960
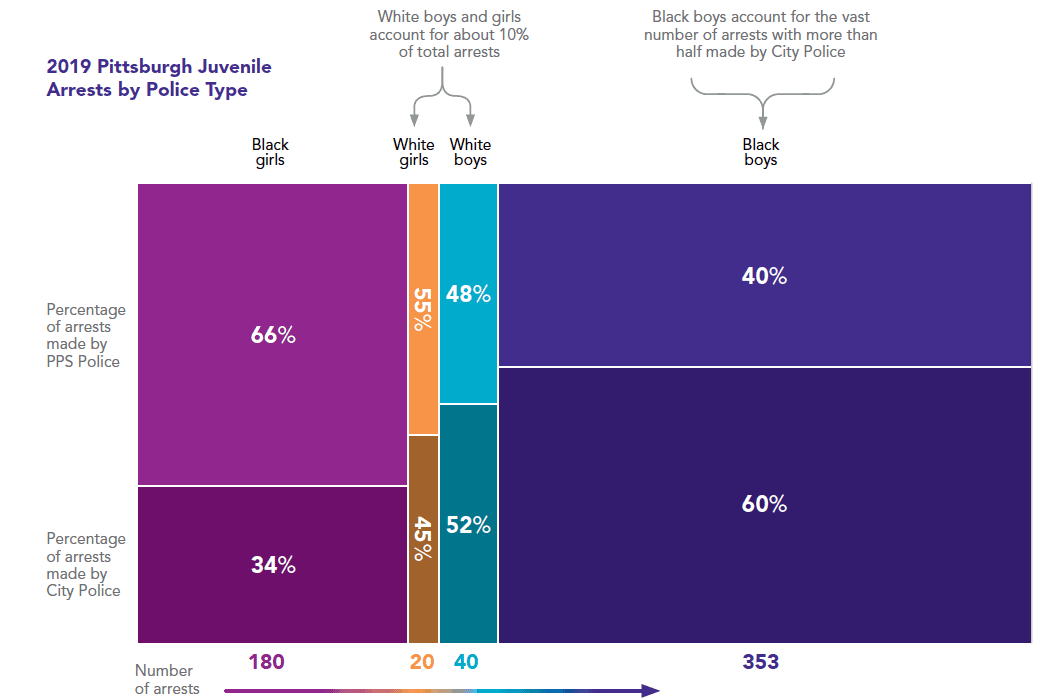
For the past few years, I’ve been working with teams of Interdisciplinary Research Leaders as they develop their research projects. Most teams are made up of three people and consist of researchers and community partners, including community organizers and advocates….
Continue reading