The importance of selling research
June 9, 2014
Leave a comment
3605
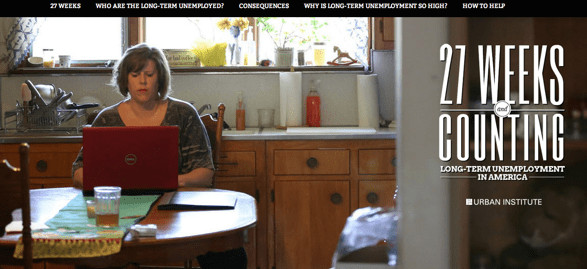
This post originally appeared on the Urban Institute’s MetroTrends blog. A quick story: A few months ago, I was chatting with one of my former graduate school professors. I was telling him about a client who was concerned that his…
Continue reading