Description
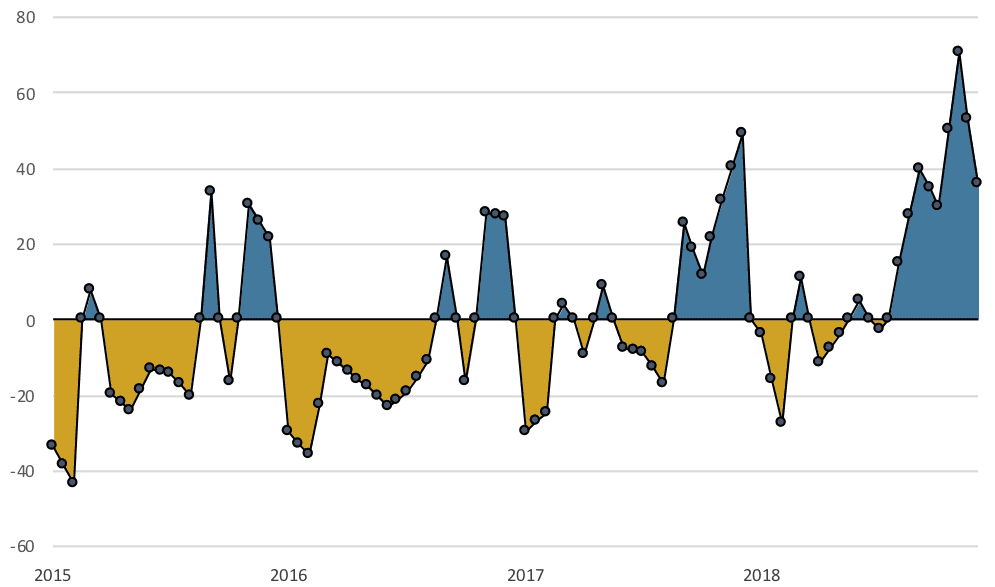
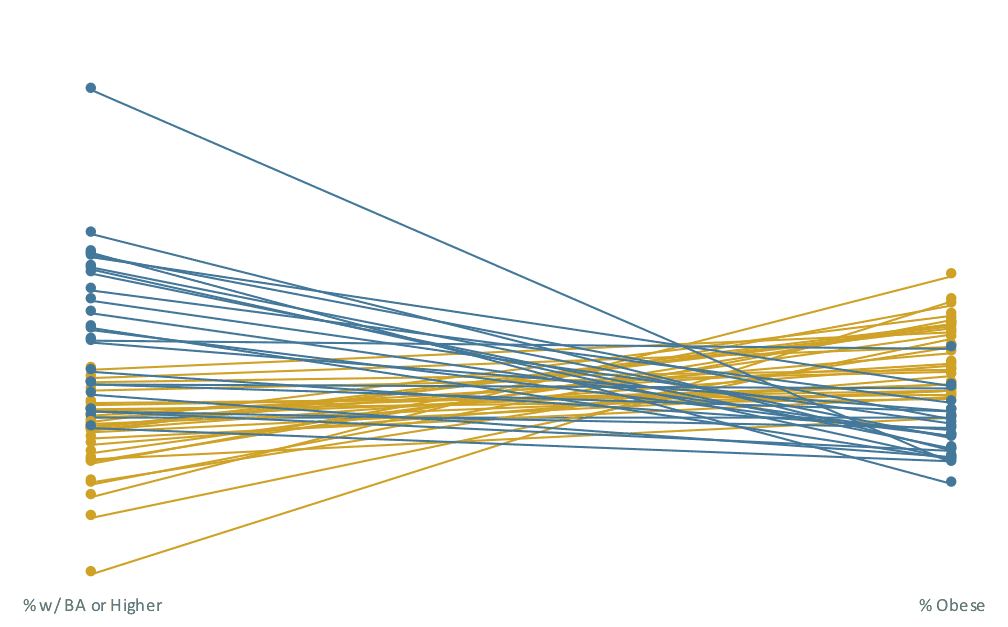
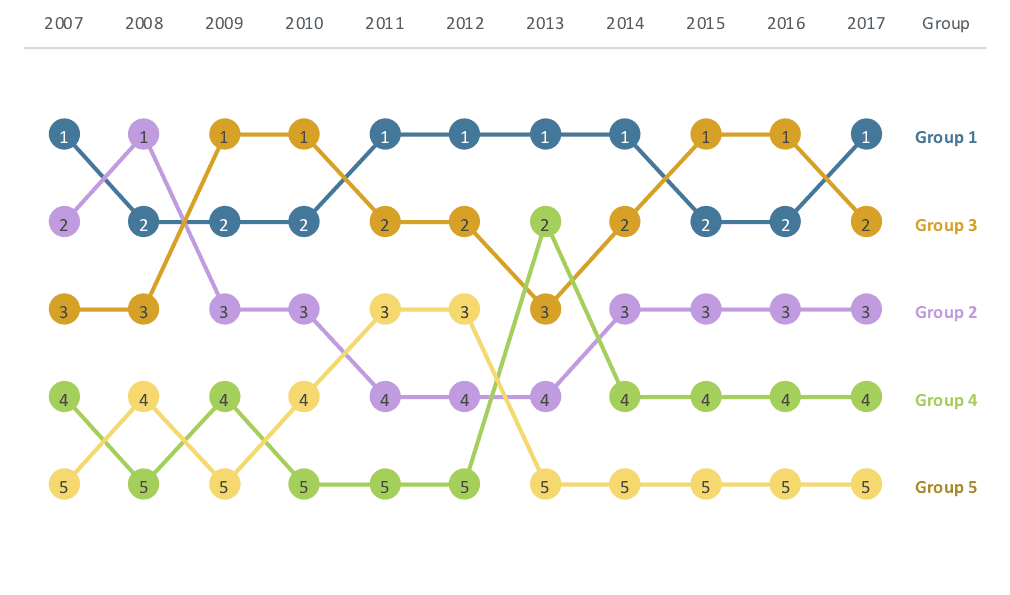
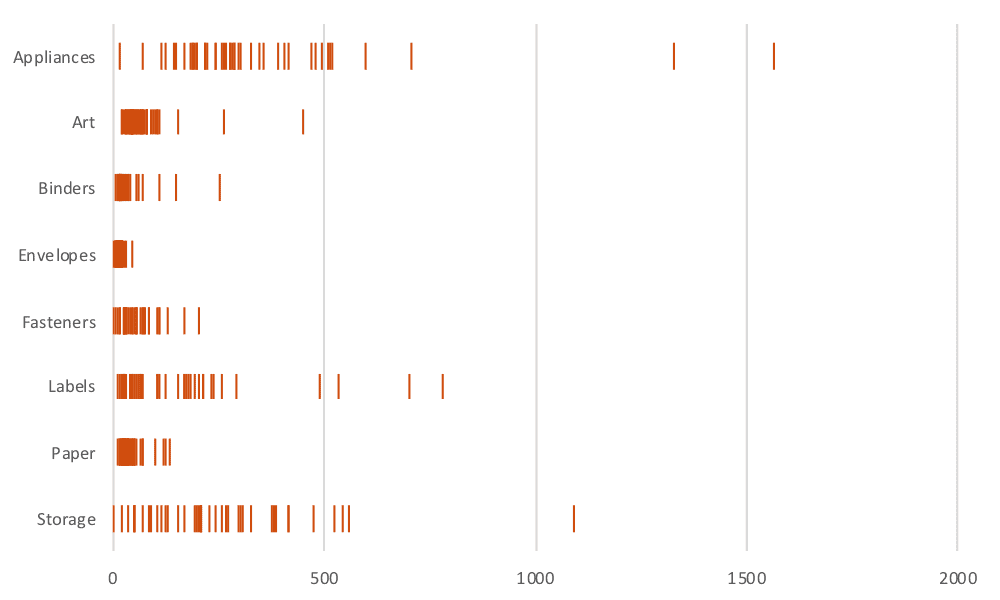
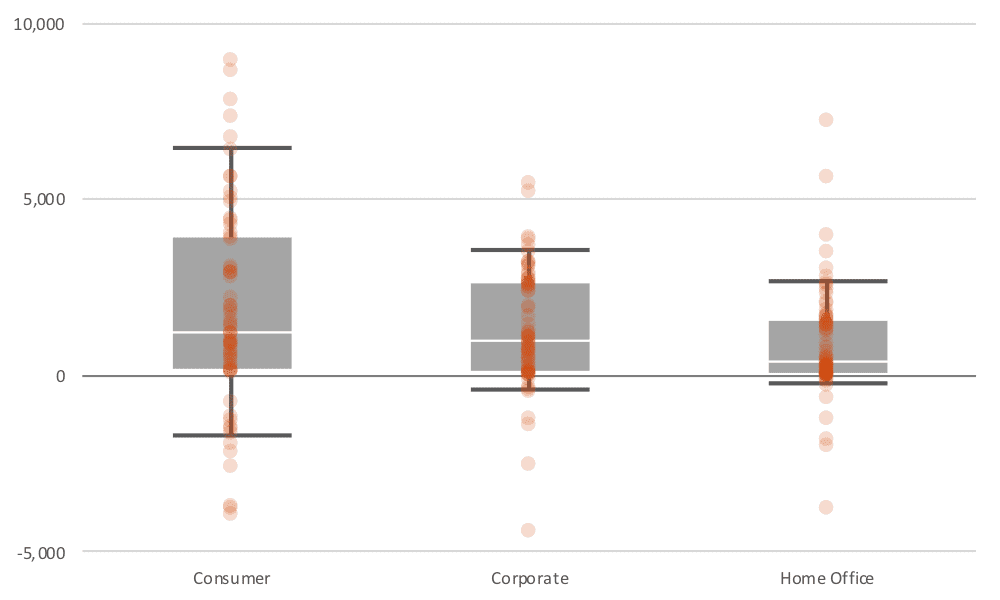
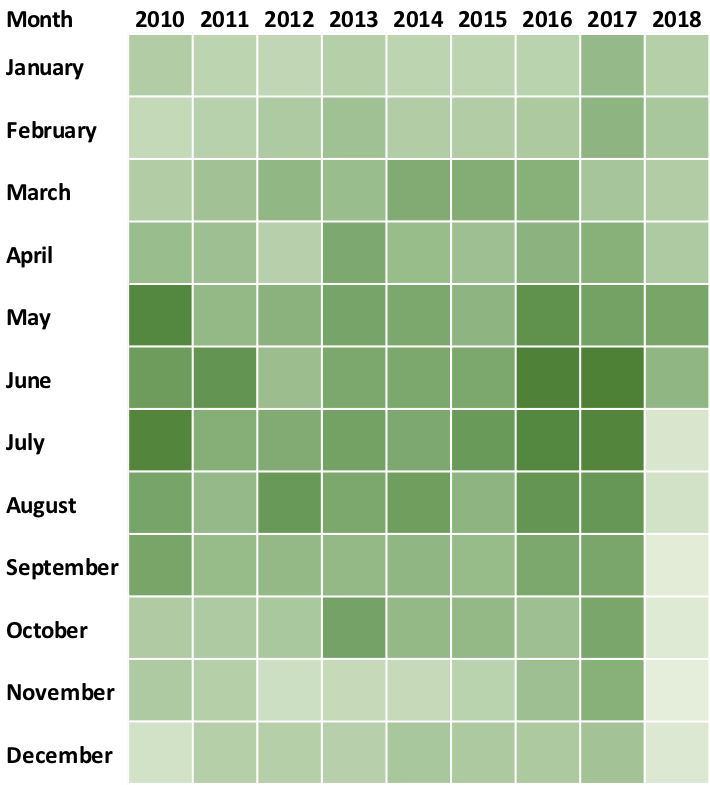
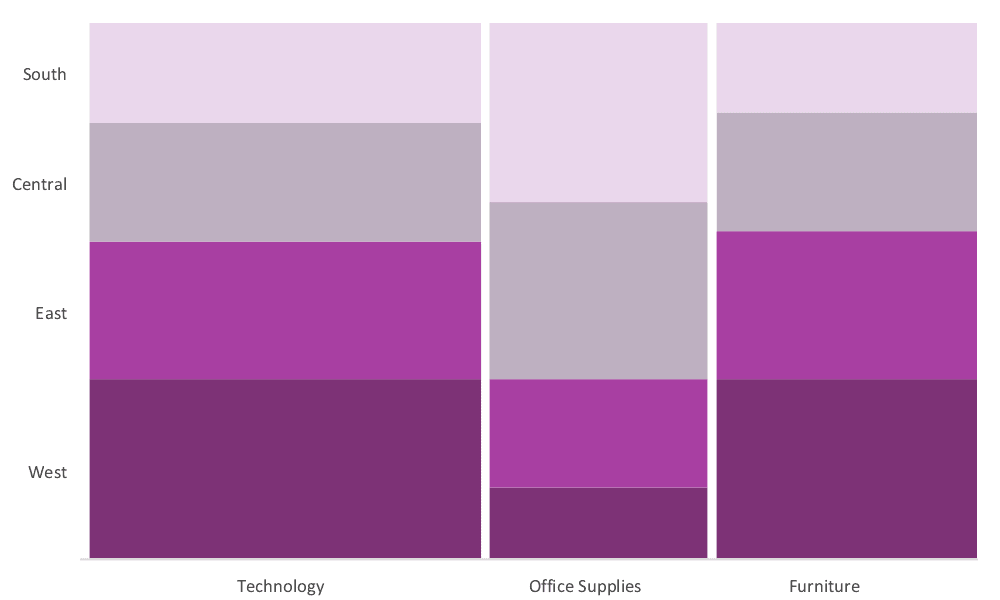
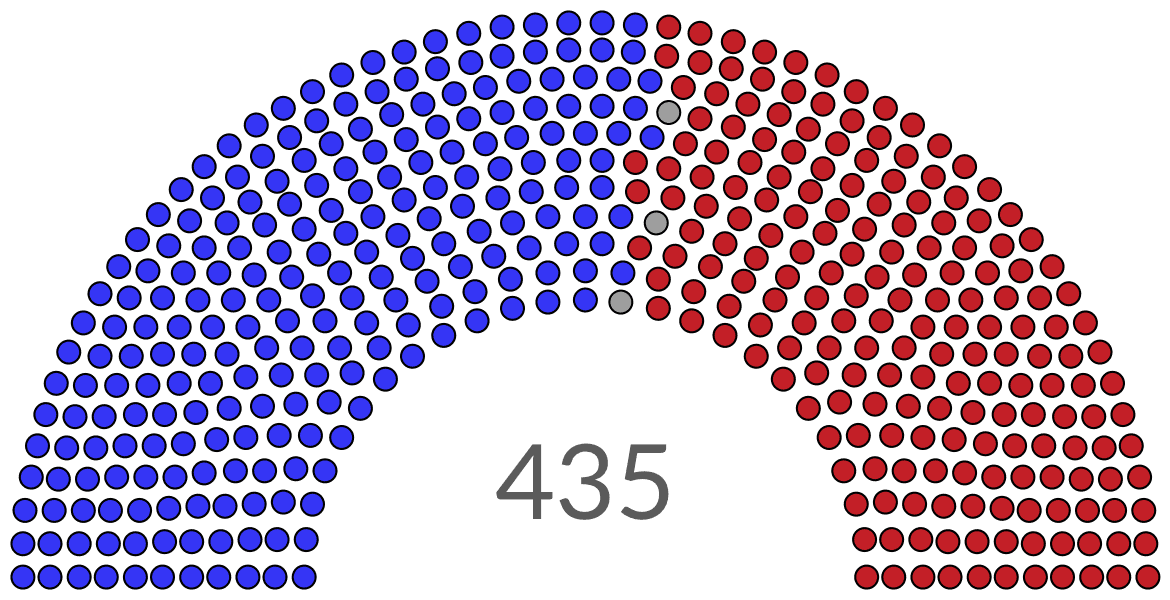
This downloadable .zip file contains eight separate Excel files, each one corresponding to a different category of the Financial Times’ Visual Vocabulary. The files contain all but 13 of the graphs in the Visual Vocabulary. Proceeds from your purchase primarily go to help support the PolicyViz Podcast, including audio editing and transcription services.
I have not included specific step-by-step instructions for the graphs in these files, but I have included some simple notes here and there to help you recreate them. I have also included some text boxes with VBA code I use to simplify the creation or styling process–VBA is not necessary to create any of these charts, but it can make some of the more tedious tasks faster.
If you’d like a step-by-step approach, please see my Excel ebooks and the Tutorial category on the blog.
As with all of the downloadable products at PolicyViz, please respect the licensing–these files are provided for a single user and should not be shared or circulated.

Reviews
There are no reviews yet.