The Graphic Continuum – Desktop Version
November 11, 2014
6 Comments
13681
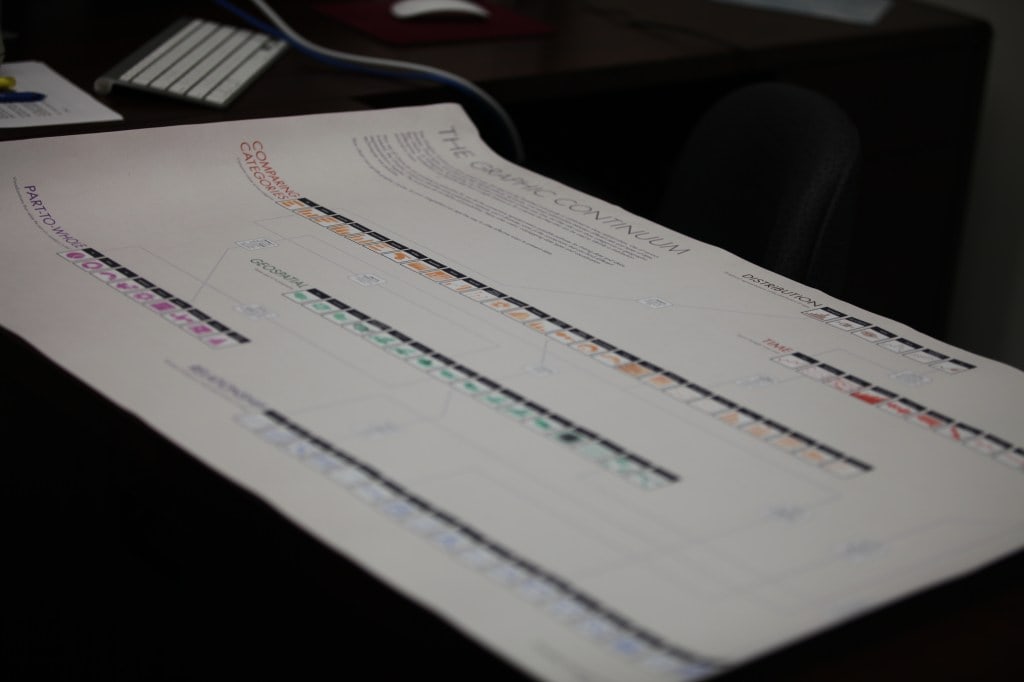
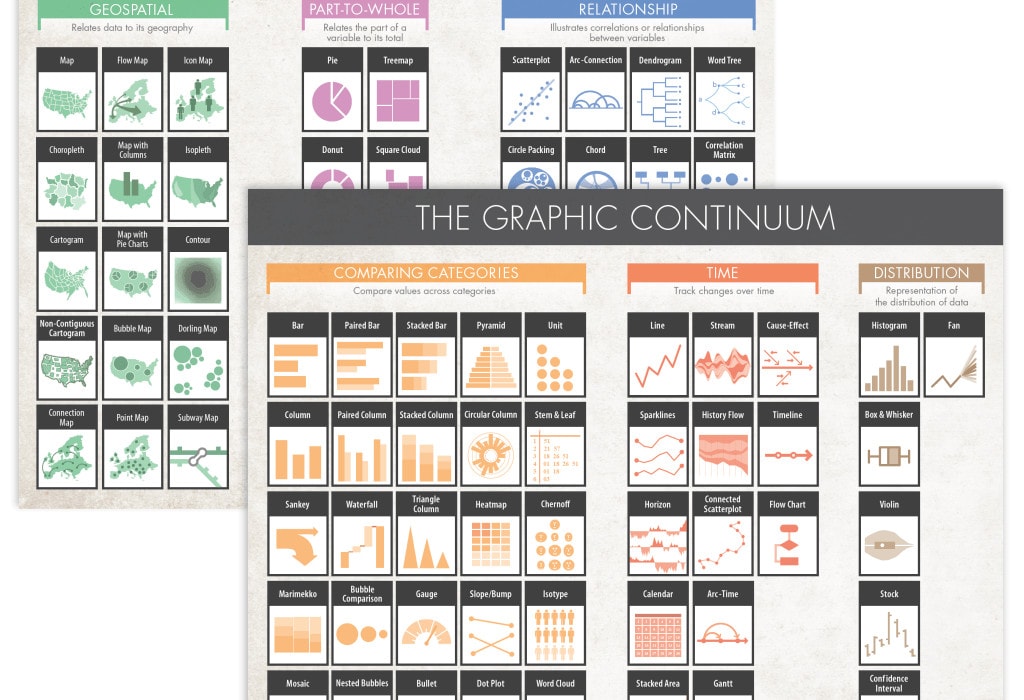
In early September, Severino Ribecca and I released a poster-sized version of The Graphic Continuum, a collection of the wide array of visualization types. In it, we plotted over 80 different graphics across six main categories: Distribution, Time, Comparing Categories, Geospatial,…
Continue reading