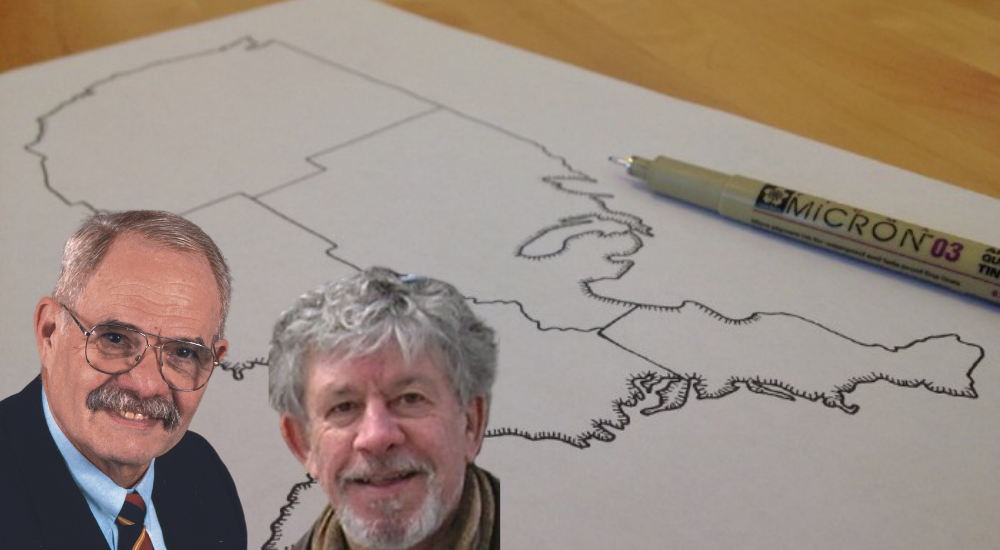
Michael Friendly is a Fellow of the American Statistical Association, a Professor of Psychology, founding Chair of the graduate program in Quantitative Methods at York University, and an Associate Coordinator with the Statistical Consulting Service. He received his doctorate in Psychology from Princeton University, specializing in Psychometrics and Cognitive Psychology.
In addition to his research interests in psychology, Professor Friendly has broad experience in data analysis, statistics, and computer applications. He is the author of Discrete Data Analysis with R: Visualization and Modeling Techniques four Categorical and Count Data. He is also the author of SAS for Statistical Graphics, 1st Edition and Visualizing Categorical Data, both published by SAS Institute, and an Associate Editor of the Journal of Computational and Graphical Statistics and Statistical Science His recent work includes the further development of graphical methods for categorical data and multivariate linear models, as well as work on the history of data visualization.
Howard Wainer is an independent statistician and author with experience in educational testing and data visualization. He received his PhD from Princeton University in 1968. He has taught at The University of Chicago, Princeton University and the Wharton School of the University of Pennsylvania. He was employed by the Educational Testing Service from 1980 until 2001 and was the Distinguished Research Scientist at the National Board of Medical Examiners from 2001 until 2016. He is a fellow of the American Statistical Association and American Educational Research Association.
Episode Notes
Michael Friendly and Howard Wainer, A History of Data Visualization & Graphic Communication
Michael Friendly GitHub | https://friendly.github.io/HistDataVis/
Milestones Project: https://datavis.ca/milestones/
Michael Friendly Site | https://www.datavis.ca/
John W. Tukey, Exploratory Data Analysis
Sandra Rendgen, The Minard System: The Complete Graphics of Charles-Joseph Minard
Brit Rusert, Silas Munro, W. E. B. Du Bois’s Data Portraits: Visualizing Black America
Leland Wilkinson, The Grammar of Graphics
Isabel Wilkerson, The Warmth of Other Suns: The Epic Story of America’s Great Migration
David Rumsey Historical Map Collection
Related Episodes
Episode #201: Leland Wilkinson
Episode #136: W.E.B. Du Bois’s Data Portraits
New Ways to Support the Show!
With more than 200 guests and eight seasons of episodes, the PolicyViz Podcast is one of the longest-running data visualization podcasts around. You can support the show by downloading and listening, following the work of my guests, and sharing the show with your networks. I’m grateful to everyone who listens and supports the show, and now I’m offering new exciting ways for you to support the show financially. You can check out the special paid version of my newsletter, receive text messages with special data visualization tips, or go to the simplified Patreon platform. Whichever you choose, you’ll be sure to get great content to your inbox or phone every week!
Transcript
Welcome back to the PolicyViz podcast. I am your host, Jon Schwabish. On this week’s episode of the show, I’m very excited to have Michael Friendly and Howard Wainer join me. Michael and Howard are legends in the field, and they have a new book on the history of data visualization, a really interesting book, especially if you’ve seen a lot of the discussion on Twitter about historical data visualizations. They give you a more thorough treatment than you’re going to get on Twitter. So we talk about how they work together, we talk about their favorite visualizations, we talk about their favorite eras of historical data visualization, really fun conversation. I hope you’ll enjoy it. So take a listen to this week’s episode of the PolicyViz podcast with Michael Friendly and Howard Wainer.
Jon Schwabish: Michael Friendly and Howard Wainer, good afternoon. Thank you so much for coming on the show. Great to see you. How are you both?
Michael Friendly: I’m great.
Howard Wainer: As well as could be expected.
JS: Thanks so much for coming on the show. I’m very excited about your book, A History of Data Visualization and Graphic Communication, if folks haven’t seen it, they will check it out by the end of this particular podcast episode, which is going to be great. I’ve got a whole set of questions for you, and I thought we would start by talking about the book itself and what your favorite parts are. The book really starts at the beginning of time of how people were drawing on cave walls and using sticks to communicate data and understand the world around them, all the way to the modern era. And I think we’ll start with maybe Michael with you, which era did you find the most interesting, what was the most enthralling for you to both research and write about?
MF: Thanks for having us, Jon. Let me start by saying, this is sort of like the scene in the Crown, where Prince Philip asks the Queen, which is her favorite child. It’s unanswerable, but I love all of these ages, but let me say, first of all, that the parsing of history into themes that have a particular order is one of the most important features of our book; yet I have to confess, I do have a favorite child, and my sympathies are most with the golden age of statistical graphics. In a sense, this was the culmination of what had been building for over 200 years, the development of wide sources of data go back to the early 1800s. The theory of measurement and statistics, that goes back to the early 1600s with mapping the heavens and navigation at sea; technology, the ability to reproduce exquisite graphs in full color was something that came into fore in the period from 1850 to 1900. In this period, there’s also some of my favorite heroes in this history, Charles Joseph Minard, André-Michel Guerry, John Snow, Florence Nightingale, Francis Galton – each of these contributed something that was new and magical in the representation of facts, important statistical and scientific discoveries, but the main thing that I love most about the Golden Age is this incredibly impressive collection of the Album de Statistique Graphique, published in France from 1877 to 1899, the most incredibly exquisite sampler of all known graphic forms and inventing new graphic forms as they went along. Their topics were sort of mundane – how’s our trade in wine and cotton doing with the rest of Europe, where should we build a railroad – but they used exquisite graphs to show things in a way that captured the eye and captured the imagination. I spent five years trying to track down the complete set of the Album de Statistique Graphique with Howard and a bunch of other colleagues. We purchased the entire set. We owned them each individually, but now, David Rumsey has acquired a new set and made them all available on his website in full, high resolution.
JS: So when you think about organizing this long history, you mentioned the distinction between chronology and theme, and I wonder if you could talk about that a little bit more for folks who may not be as familiar with the history of data visualization stretching all the way back?
MF: Okay, let me go on that. So when I was first cataloging and organizing the material in my milestones project, it struck me that each of the periods of time, 1600s, 1700s, roughly in centuries, had a coherency that went across not only the kinds of graphs that were produced or maps that were produced, but in terms of the important problems of the age. So the 1600s, I call, the period of measurement and theory, this was the time that European countries were competing for markets for discoveries of new territory for what would become their colonies and sources of great wealth. Well, this took the combination of scientific measurement and recording of information about past voyages. Edmund Halley made an incredible isogon map of declination of the magnetic compass at sea, like, if your compass is drifting, you’re going to get lost really soon. He did this from remarkably few observations, but that was an important contribution both to navigation and to graphical display using interpolated curves on a map from very little data.
JS: Yeah. So you’ve mentioned a couple of times the interplay between statistics and graphical methods, and I’ll turn this over to Howard, I’m wondering whether you think either could have existed without the other?
HW: No. What more?
JS: I mean, maybe there’s no more to say, but maybe some more, yeah.
HW: Have you ever testified in court? The instructions you get from a lawyer is that the answers are yes, no, I don’t know, and blue.
JS: Why blue? What is blue?
HW: If the question was what color car was they driving, the answer is not a Blue 57 Chevy.
JS: It’s just blue.
HW: Anyway, I think the story begins in the contrast between Plato and Aristotle, because it’s the idea of rationalism versus empiricism, and empiricism, without the idea of empiricism, there’s no need to have data. If evidence doesn’t matter, then data doesn’t matter, and if there’s no data, there’s no graphics. And so, you couldn’t have graphics, unless you had a belief that data mattered. And, in particular, if you wanted to make claims, you needed evidence to support those claims. Unfortunately, when Aristotle was making his point about evidence, he had Alexander the Great backing him up, and so, he didn’t screw around with Aristotle, because you had to deal with Alex. But it died out, at the end of the golden age of Greece that died out, and it didn’t come back again until Bacon in the 15th century, and then the other Bacon a little later. But really empiricism didn’t really get rolling until the British empiricists, and particularly Hume, and it was only when the idea that if you wanted to learn something, you needed to have data, you had to have evidence, and you couldn’t just guess, and that’s not fully absorbed now either. You have lots of arguments being made in the absence of data or in conflict of data, and that’s going on and on now to this day. But somewhere around the 18th century, where the British empiricists got rolling, this is certainly only in the West, people started gathering more data, and whether it was health data or crime data or weather data, and somewhere along the line, they discovered that the best way to see what was going on is literally to see what’s going on. And that brings in one of the heroes that Michael didn’t mention, and that’s William Playfair, who is an 18th century scoundrel, but he was the one that invented most graphs. Of course, they were maps and things like that, but that’s really the – everything hangs on the philosophical basis of empiricism, without that we haven’t got anything.
JS: Right. So you started with Plato and Aristotle, so we’re zipping forward now to the last, say, 34 years, and I’m curious, because these two things are so intertwined, why do you think folks in math, statistically data dense fields like economics and maybe sociology and statistics and mathematics, why are their visualizations just often so bad?
HW: Because…
JS: [inaudible 00:10:12]
HW: Instruction can help cure ignorance, but not stupidity, and consequently, people are drawn to what’s flashy rather than what works. And to determine what works requires work, running little shoebox experiments, and you ask not which graph do you like better, but which way is the wind blowing, and where did the storm come from. Michael, you’re chomping at the bit, you go.
MF: Well, let’s put it in a wider context. I think of statistics in the development of statistical theory as the glue that binds data to discovery and persuasion. So the very idea of taking the average, this was revolutionary in days when different observers were recording the transit of Venus, and using that to calculate the shape of the earth, well, you had three or four different people making the same measurement, but they differed. The idea that you could take the average, and that would be a meaningful thing rather than taking the one most trusted, or the observer who’s most trusted by the Royal Astronomer, what graphs did in this history of combining statistics, with data and reasoning is it allowed people to see the patterns, the trends. What stood out as an anomaly is this confluence of data, statistics, theory and graphics that I think is so compelling.
JS: Now, Howard, you mentioned a few moments ago, that people see things that look kind of showy, they think it looks kind of neat, and so, that’s what they create. I want to just read one of my favorite sentences from the book, so in the last chapter, you both write: visual displays of empirical information are too often thought to be just compact summaries, that at their best can clarify a muddled situation. This is partially true as far as it goes, but it’ll miss the magic, and I wanted to get your sense of the magic. Do you get a sense that there are some folks in the field that are very dogmatic about, you never, ever, ever, ever make a pie chart, you never use anything that’s circular, it should be bar charts and line charts, and there’s lots of phrases and terms that we could reference and use. But do you feel that that removes some of the magic from the field?
HW: Well, the magic comes from what data it is that you’re showing. There was some guy who mimicked Minard’s plot of Napoleon’s march, you know, one of the most wonderful plots that’s ever been made. And he had some data about AOL stock prices that he was showing. It wasn’t all that interesting. If you don’t have interesting data, you got to have interesting graphs. Now, we omitted what I consider to be one of the most important points, and Michael alluded to it, and that was in 1962, when John Tukey published an article called The Future of Data Analysis; and in it, he pointed out that the role of data analysis in statistics is discovering things, trying to find things, and he concluded that the best way to find what you weren’t expecting is through the use of graphic displays. There were a couple of 19th century economists named Farquhar two brothers, they said that trying to get information from a table is like extracting sunbeams from a cucumber, it’s in there, but you can’t see it; and the ability to be able to see things that you hadn’t expected was what makes the graphics powerful. And Tukey being a world class hotshot, when he came out in favor of this in 1962, it made it okay for the rest of us.
JS: So even by 1962 or maybe especially my 1962, Tukey was the person that everybody looked to?
HW: For certain kinds of things, yeah.
JS: Right. To say that this is okay, that this is the sort thing that we can be doing.
HW: That’s right.
JS: Interesting. So I want to talk about historical data visualizations kind of more broadly, I wonder what you would say to folks, maybe, Michael, you can start on this one, I wonder what you would say to folks who say, yeah, historical data visualization is neat, I’ve seen Minard, I’ve seen Nightingale, I’ve seen John Snow, they’re neat, but there’s not much to really learn there, because I have to do mine, I’m coding in JavaScript or I’m doing something for a mobile phone, and so, they need to look at, they’re kind of cool, but there’s really nothing to learn there, I’m curious what you would say to a person who maybe feels that way.
MF: Jon, before I answer that, let me just go back to Minard for a second. So why was it that Charles Joseph Minard’s incredible depiction of the near destruction of Napoleon’s army was so powerful? It was essentially meant as an antiwar statement. He was appalled by the tragic loss of nearly all of the French army, and he wanted to point it out in a way that spoke to the hearts and minds of his viewers. E. J. Marey who was the first one who noticed Minard’s graph said it defies the pen of the historian and its brutal eloquence. So that is part of the magic of graphs. On to the idea of, well, we’ve got all this software today and why do we need to worry about it? Well, what we’ve learned in the most recent history of data visualization is that we really needed a coherent, overarching theory of graphics, and the production of graphics, and that came with Lee Wilkinson’s Grammar of Graphics – I was pleased to note that you did, I think, the last podcast interview with Lee before he tragically died. So this provides an overview, an overarching framework, and, most importantly, it creates an easy path between having an idea in your head, oh, I want to make a graph of COVID outbreaks and how it’s been moderated by the introduction of vaccines or other things. Having that idea, and going to somebody you can see on a screen or on paper is, I think the most important contribution of modern statistical software. What that leaves out though is the question of graphical impact. Tukey famously talked about the idea of inter-ocularity of a graph. The inter-ocular traumatic test is that a graph, a good graph should hit you between the eyes, you should know its meaning and impact immediately. Well, software doesn’t help with that. What is important for a graphic designer or a graphic communicator is to have a crystal clear idea of the message they want to convey, and think of, okay, I have all these tools, how can I use them to create a graph or graphical display that is impactful, that gets to the hearts and minds of my audience; just like Florence Nightingale was successful in her radial diagram showing the deaths in the Crimea, she could have used a simple line graph, but that would not have gotten the attention of members of the British Parliament who were tasked with trying to see what they could do about the disastrous loss of life, not on the battlefield, but the people who got sick from septicemia and died from septicemia.
HW: We try to get to this a little bit in chapter 10, to try to show how you could take a modern question, in particular, the question of the movement of African Americans from the South to the North. And Du Bois was desperate to show that, and he tried very hard to show all sorts of things, and if he had just borrowed some of the techniques that Minard had developed, he could have come up with something else. And so, we made up the story of Minard meeting with Du Bois in Paris, and over cocktails working out this picture. There’s a song that Du Bois sang to Minard to get him to come along and help – I don’t know, if I play that, would you be able to hear it?
JS: I’m not sure. Why don’t we give it a shot, and if not, I’ll stick it in the recording later.
HW: Why don’t you to talk while I try to find the goddamn song.
JS: Okay. So I was going to ask, the title of the book is History of Data Visualization and Graphic Communication. I’m not really sure what the question is, but like, maybe the question is, how do you distinguish between those two things, data visualization and graphic communication, or maybe the better question is, why do you distinguish between them in the title.
MF: Well, one of the things that struck me in writing the book was how this entire history or part of it was the rise of visual thinking, the ability of not only scientists or economists or statesmen like Playfair to think visually, but for their audiences to think visually. So graphic communication is the idea of being able to tell your story in the way that will most resonate with the audience, so one early story of Michael [inaudible 00:21:18] the first statistical graph in 1642, he had the idea for a new way to determine longitude at sea, he wanted to sell it to the King of Spain, he wanted a patronage appointment. What he did was he gathered all the previous determinations, and he wanted to show the king, oh my god, everybody is making extravagant errors, the results are all over the map. He could have presented this stuff in a table, but only a graph had the power to show exactly what he was trying to show that everybody else was totally wrong, and therefore you should fund me and give me a life appointment.
JS: Right. Interesting. So Howard, do you have our song?
HW: I do.
JS: Okay.
HW: Because in the Paris Exposition of 1900, they had the first talking movies, and so, they were able to record this song that the boys used to lure Minard to help them out in this. So here’s what we’re able to recover.
[Song Being Played]
HW: As you might have noticed that tune was coopted later on for a James Bond movie.
JS: I mean, I think, yeah, all data visualization folks try to strive to be like James Bond, yeah. Okay, so explain that again, so that’s Minard and Du Bois?
HW: Du Bois, that’s right. See Du Bois had data, and the reason he had data was that census started collecting data on African Americans, after, I guess, it was starting in 1870, for the first census. Up until then, they had collected data, but it was as property, like, three cows and two slaves and that sort of thing. But starting in 1870, they were collecting data, and so, with data, you’ll be able to find out things, you can answer things, and Du Bois was wonderful at being able to look at the data and tried to tell a story. And he chose graphs as a way of doing it, and he had 56 different graphs that he displayed in Paris on the ways of black folks. But the big story of the idea of the migration, the great migration was very hard to be told, and Minard, of course, provided the way to do that. And so, that’s the story that’s told in chapter 10, and there’s a Yiddish term that goes for that story, it’s called a [inaudible 00:24:38]. Do you know what that?
JS: I do. My mom who may be listening to this episode will really enjoy the fact that that may be a first occurrence of Yiddish on the show.
HW: I was thinking of Yiddish the other day, because the Eskimos have 56 words for snow, and Jews have schmuck [inaudible 00:25:03]. So we’ve got 86 words for loser. There must be something relevant there.
JS: Something matched up there, yeah. So I want to ask one last question on the development of the book, maybe this is better as the first question, but I wanted to ask, you two have known each other and worked together for a long time, I wanted to ask how did this book come together, what was the process like? So maybe Howard, you can start on the history here, the origin story of the book, as it were.
HW: Well, Michael and I had been working independently on the general topic of data display for the better part of 40 years, and each of us had gone in their own direction. But it became clear, at least to me, that time was running out, and we needed a coherent statement, that the field needed a coherent statement, because it had been more than 80 years since there was one, and that was some guys master’s thesis. It was really good, but, I mean, it’s Funkhouser. And by putting everything together, I felt that we could not only lend some coherence to the field, but also highlight what are the areas that we don’t know about; and by we, I mean, Michael and me, or don’t have time for. And so, I felt that if we got this thing going, it would be a good thing, and Michael’s done such beautiful work, I mean, really, the various bits and pieces that he’s done over the years are really wonderful, and I know he was saving them up for a book that we’re going to be ready in 50-60 more years. And so, it was mostly me saying, come on, let’s get this done, and him saying it’s not ready yet, we got more to do, we got more to learn. And so, we finally did get it done, and he’s still working on the second edition, because there’s so much more we didn’t do.
JS: Right.
HW: I’m not sure I have the wit or the energy for a second edition, but I’m glad the first edition is out, and it really showcases a lot of Michael’s contributions over the years.
JS: That’s great. So Michael, what for you, I mean, in any book you have to sift and winnow down to get it done, so are there things in your head, big topics, big themes, big visualizations that didn’t make it into the first volume?
MF: Oh my God, so…
HW: [inaudible 00:27:44]
MF: About half of the material that we originally had planned on, could not find a place in the book or went on the cutting room floor of editing. Our contract called for 50,000 words. Who knew when you’re starting to write a book? What’s 50,000 words? By the time we were finished, we were up to 150,000 words. So we had to fight tooth and nail with our editor at Harvard University Press to compromise at 100,000 words. Nonetheless, there are so many areas that we did not explore, we omit nearly all mention of modern data visualization. Lee Wilkinson who wrote a wonderful review of the book, privately said to me, oh, you didn’t mention Grammar of Graphics. And I said, oh my God, I am so sorry, but we decided to sort of basically cut things off around 1975 or so. Howard mentioned earlier in our discussion, the whole idea of non-European contributions to the history, the rich history of data visualization, and information visualization. We don’t have enough material, nor is there a coherent structure for thinking about those really brilliant, non-European developments, but that is something that I think of, oh, maybe someone else will write.
JS: Well, let’s hope so. I mean, this is a great book, great synthesis of the field. I hope everyone will check it out. The History of Data Visualization and Graphic Communication. Michael and Howard, thank you so much for coming on the show, it has been great chatting with you both.
HW: Well, thanks very much for asking us.
MF: Thank you so much, Jon. I really enjoyed your other podcasts and I’m looking forward to hearing this one.
JS: Thanks. Great. Thanks again.
Thanks everyone for tuning into this week’s episode of the show. I hope you enjoyed that conversation with Michael and Howard, and I hope you’ll check out their book, I’ve linked to it and many other things in the show notes on the website for this episode. If you would like to learn more about data visualization, check out my new Winno community – instead of cluttering up your inbox with newsletters and other things, I’m using Winno to send you two or three text messages each and every week about data visualization strategies, big and small. So head over to winno.app/policyviz to learn more. So until next time, this has been the PolicyViz podcast, thanks so much for listening.
A number of people help bring you the PolicyViz podcast. Music is provided by the NRIs. Audio editing is provided by Ken Skaggs. Design and promotion is created with assistance from Sharon Sotsky Remirez. And each episode is transcribed by Jenny Transcription Services. If you’d like to help support the podcast, please share it and review it on iTunes, Stitcher, Spotify, YouTube, or wherever you get your podcasts. The PolicyViz podcast is ad free and supported by listeners. If you’d like to help support the show financially, please visit our PayPal page or our Patreon page at patreon.com/policyviz.


