
Rebecca Pazos is a mum of one and a senior data journalist with The Straits Times for six years. Recently, she completed her Masters in visual tools with the University of Girona. She is dedicated to telling compassionate, human-centered data stories.
In this week’s episode of the podcast, Rebecca and I talk about her work at The Straits Times, the make-up of the graphics team, and considerations of data visualization in Asia. We also talk about the graduate program she is currently in and some of her personal projects.
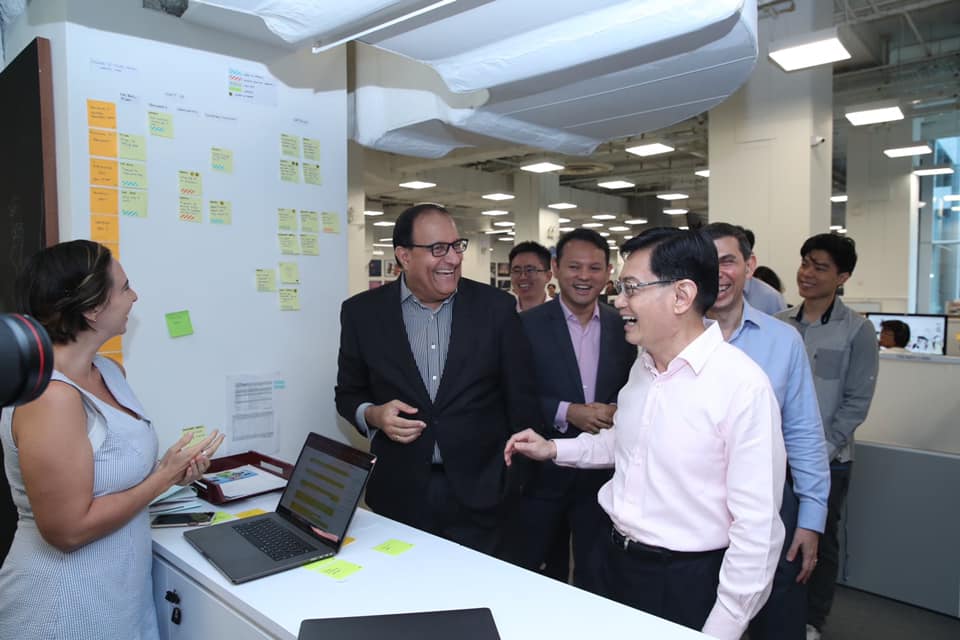
S Iswaran, former Minister for Communications and Information, now Minister for Transport; Chan Chun Sing, Minister for Trade & Industry, and now Minister for Education; Heng Swee Keat, Deputy Prime Minister. Just behind him is Warren Fernandez, Editor-in-Chief of The Straits Times. Taken pre-covid (no masks!!) in November 2019.
Episode Notes
How the world lost 1 million lives to Covid-19
Related Episodes
Support the Show
This show is completely listener-supported. There are no ads on the show notes page or in the audio. If you would like to financially support the show, please check out my Patreon page, where just for a few bucks a month, you can get a sneak peek at guests, grab stickers, or even a podcast mug. Patrons also have the opportunity to ask questions to guests, so not only will you get a sneak peek at guests but also have the opportunity to submit your own questions. You can also send a one-time donation through PayPal. Your support helps me cover audio editing services, transcription services, and more. You can also support the show by sharing it with others and reviewing it on iTunes or your favorite podcast provider.
Transcript
Welcome back to the PolicyViz podcast. I am your host, Jon Schwabish. I hope you and your families are well and healthy and safe. I hope you’ve been enjoying the last few episodes of the podcast. I’ve really enjoyed talking to my guests. I’ve also enjoyed piecing together the various video parts of the podcast. And if you want to watch my conversations with my different guests, head over to my YouTube channel, it’s been pretty fun trying to put that together, it’s a new challenge. I’ve also been doing a lot more work with my newsletter, finally have, I think, a system set up. I’ve been writing some more behind the scenes blog posts and some other blogs and some DataViz content that hasn’t yet made it to the full blog. So if you want to get that sort of behind the scenes look, you want to check out some content that maybe isn’t going to make it on policyviz.com, check out the newsletter. But on to the podcast – so on this week’s episode of the show, Rebecca Pazos joins me. Rebecca is an interactive graphics journalist currently with the Straits Times in Singapore. I was really interested to talk with Rebecca because, first off, her work is just terrific. The types of visualizations that they often create in some Asian countries, at least, the work and the people that I’ve spoken to, tends to be a lot more data dense, a lot more different than some of the work that you might see in European countries and the United States. And so, we spent a lot of time talking about those different audiences, and what goes into the data journalism and the process at the Straits Times. And then we talk about a few of Rebecca’s personal projects that she’s worked on, including a master’s degree that she’s currently pursuing. And so, you can link to all – you can see all the links to all those projects and stories and her profiles on the episode notes, and so, I’m going to turn it over to our conversation. So here’s this week’s episode of the podcast with Rebecca Pazos.
Jon Schwabish: Hey, Rebecca, good morning. I guess, my time good morning, and evening, your time. How are you? Welcome to the show.
Rebecca Pazos: Good. How are you? Thank you for having me. I’m so excited.
JS: Yeah. I’m excited to have you too, because we’ve been sort of talking on and off now for almost a year, I guess, right? Because we were talking about – I saw some of your great work early in the year, and then I asked you to do that video for the one chart at a time series, and then we were talking about doing this, and then summer happened, and then finally we were able to have this conversation. So I’m really excited.
RP: Yeah.
JS: As I was sort of talking about, before we started recording, I feel like there’s this focus in the DataViz world on the New York Times graphics team and the Washington Post and The Guardian; and then after, like sort of the US and Western Europe, it’s sort of like tails off, like, there’s just like the attention that the Berliner Morgenpost gets, and the Hindustan Times, and The Straits Times gets, sort of, like diminishes. And for not for lack of quality, just for lack of the world, I guess. So, I was hoping we could talk about your work at the Straits Times, what the team looks like, and maybe if you have thoughts on how communicating data in Singapore might differ from communicating, if you’re primarily on the east coast of the United States. So I know that’s a broad question, but I’m just going to like pass that to you, I guess, to start.
RP: Let’s dive in. Yeah, I mean, if you haven’t noticed already, I have an Australian accent, and I’m originally from Australia. I moved to Singapore about eight years ago now, so the Asian perspective is still very new to me. But, I guess, having worked at the Straits Times now for, going on six years, I’ve definitely become more aware of the differences, I guess – I don’t have experience with the US side of things, but at least I have a Western upbringing, and I kind of know where we come from in that regard, and how it’s different here. So actually Paye Inglot just published a story on DataViz society today it was. But if we need to say a date, it’s 26th of August. So she published an article. She runs Continentalis, which is the DataViz, kind of like [inaudible 00:04:38] but in Southeast Asia. And she published a story today exactly about this issue about the fact that most DataViz storytelling, especially from the media side of things, tends to focus on the Europeans or definitely in the US. And that has expanded out, I think when I first started, it was very, very new. We had some interest in open data. There was an open data movement in Southeast Asia. The Singapore government had set up a data portal here. So it was very exciting, when I first started to see what was going to happen out of that, for this particular region. And I guess, since then, in the beginning for our team, specifically, we started off just myself, a developer from Peru, and my husband as the designer who’s from Argentina. So we were completely foreign talent in the [inaudible 00:05:42] room.
JS: Right.
RP: Yeah, doing the thing that no one knew really what we were doing. And a lot of it gets tied up in visual storytelling, and not so much data storytelling. So that’s a battle that I’ve been dealing with, just like from a news perspective, they’re very used to graphics in print or comics even in print. That’s something that they can relate with. But moving it to complex data visualization has been a bit of a struggle, and I think, in the last six years, now we’ve started to sort of slowly gain grounds there at the Straits Times. So now our team, we have dedicated data journalists as well, which has been a big leap. We still don’t have like a data editor, which I think is something that’s missing, someone that really knows how to present data and knows its biases and knows its ins and outs, so it’s sort of not something that we have yet. But data journalists, yes, which is why which has resulted in that project that we were talking about last year on the COVID’s one million deaths with the stream graph.
JS: Stream graph yeah.
RP: Yeah. So when we managed to actually get that published and passed to our editors, it was like, amazing, because that’s pure DataViz, and it’s really nice to see that kind of come through and be published and recognized as visual storytelling as well beyond just like the fancy stuff. And to me, it’s fancy, and I love it, but they’re not used to it, yeah.
JS: Right. So I’m curious on the data editor, like, if you had the power of the budget and the power of the hire, how would you write that job description, or, I guess, what would be that data editor job at the Times?
RP: So I guess, there’s a lot of misconception around the use of data, and a lot of journalists like in the Straits Times – this is probably common, like, it’s surprising how common these issues are, and even [inaudible 00:08:04] right?
JS: Yeah, because I think data is just like, it doesn’t matter what language you speak or where you are, like, data are data, and we all have the same challenges with it, yeah. I’m curious, like, the only other data editor that I’ve heard of in media, and I’m sure there are many, but the only one I’ve heard of is Amanda Cox. I think she is in that role now at the New York Times, but I’m curious, like, what would that job be, and what would they do, and then, I guess, what I’m trying to get at is, do you see that – so I’ll reveal my biases about how the newsroom works. So I sort of imagine that there are your sort of traditional journalists, and then there are sort of data journalists who are doing more sort of code, and then there’s kind of a design team. But a data editor, I would imagine in my head, as sort of an umbrella across everybody. And I don’t know how like it all intersects, so that’s like, how would you build that structure?
RP: So I guess, I mean, I can pinpoint it to an exact example is the coronavirus data. Right?
JS: Yeah.
RP: I think we have all seen how important it has been to be reporting on this data, and how fickle the data is as well. I guess, the word would be fickle, is that we have all this data and it’s amazing to have it, but the impression that it leaves on people can be misconstrued very easily. So I mean, even more specific than COVID data, a specific example with vaccination data is the, as the cases sort of grow amongst those that are vaccinated, as people who have vaccinated, there are new cases, and it has left an impression that even though you’re vaccinated, you’re still going to get infected. And there were a few stories published in The Straits Times that were looking at how a lot of cases were fully vaccinated, and I think it gave the wrong impression to people that do vaccines actually work, and it starts to cause some, like, contention in society. Right? So to me, a data editor is someone that can flag that and just be like, hey, we need to do a story on this or we need to show the data in a different way, or we need to accurately represent that in a different way, because I think when the average analyst is looking at this data, they don’t have the knowledge of being able to actually process the bias in data, and to see how it’s coming across, they just kind of see these big data points, and they’re like, oh look, the 100 cases yesterday, 80 of them are vaccinated and like, look, it doesn’t work. So that, to me is something that a data editor should be able to come in and sort of flag; and, as a data journalist, you would pick that up; but as a traditional journalist, maybe you wouldn’t see those kinds of flaws in the data.
JS: Right. Yeah, it is interesting to try to build out that. I mean, there are editors, and it’s like the editors on the words, but like the editors on the data, and the data has become so much more important. It’s interesting to think about how we, not just media, I would think, like, lots of places might need that data gatekeeper in some sense, yeah. So you mentioned earlier sort of evolution and how your readers have grown more accustomed to the DataViz and the data journalism at the Times. Can you talk a little bit about the balance between – and you mentioned this a little bit, but just to dive a little deeper, the balance between the print side and then the online kind of interactive side, like, how have you seen – I mean, you’ve been there for six years, which is a pretty long time and a pretty important moment in how DataViz is working. So in those six years, how has that evolved, how has that changed?
RP: Not much, fortunately.
JS: Oh really?
RP: Yeah.
JS: Yeah.
RP: Yeah, I mean, look, I’ll be honest, like, coming from Australia, it’s a very tumultuous media landscape. And you’re kind of, in that landscape, you’re forced to move to digital much faster than any other place. And so, Singapore has a very kind of sheltered existence that we have only two main news outlets really, news companies that dominate the market, and The Straits Times is the only sort of major newspaper here. So they, for a very long time, have had all of the advertising money and that thing that’s been happening in the US and everywhere else, hasn’t happened here yet, but it is coming, it is slowly starting to happen. So they haven’t had that need to just push into digital and to push into innovation, basically, for storytelling. And so, our team has always been seen as I think like a nice to have, kind of, like, okay, we have a team that does this, this foreign team, Argentinean, Australian, Peruvian little team in the [inaudible 00:13:27] and that’s definitely benefited us, because for a long time, we weren’t part of the regular news cycle, we weren’t kind of forced into that, and we had the space to be creative, and to kind of push boundaries and develop our systems and our coding and that kind of thing. So I think that really helped. It’s led us to produce stories that I think have kind of really touched at least the younger generation of Singaporeans, like, every time, we have an internship round, they’re always like, oh that, we do a mapping of all of the Singapore streets and they absolutely love that kind of thing – the gerrymandering graphic that we did, where we really looked at political boundaries in Singapore for the elections. Definitely they see these things and their eyes open, and they go, oh, The Straits Times can actually produce this kind of content. And I always get really good feedback for that, just in terms of, like, we have to be a little bit creative in terms of the data that we get as well – that’s true for anywhere that you are in the world, I think.
JS: Yeah.
RP: So in the US you have, I guess, a Freedom of Information clause – you can, with a lot of effort and energy and resources, get something sometimes out of places. But in Singapore that is not even an option, like, you get the data from the government or you don’t. And usually, the data is very, very clean, not granular enough to do the meaty kind of visualization. So we’ve had to be a little bit more open to kind of sourcing other data points. So, for example, the Singapore Straits was one where we went through two books, and manually, like, sampling through…
JS: Wow.
RP: Yeah. We got two books, and we had a couple of interns and me and the interns took, you know, you take A to B, and I’ll take the rest, we’ve broken up that way. We managed to classify – thankfully, Singapore is quite small, so it’s not…
JS: Yeah, right.
RP: Yeah. We have to be a little bit outside of the box sometimes to get those media sort of datasets to do something nice with them. The gerrymandering one, for example, I had an intern for about a year beforehand, before the elections, hand-drawing the boundaries from PDFs.
JS: Wow. Yeah. So I want to talk about the gerrymandering piece in a moment, and I’ll link to it in the show notes, because I have a question for you about that. But for you, specifically, having done print now, primarily, I guess, for a while, like, do you feel like just from your personal interests and perspective, do you feel like you’re excited about this push into digital, or, do you like the print, you know, that idea of people like sitting down with a piece of paper and holding in their hands and working on it, or, are you excited about all the things that, you know, the animation and the things that move around, and the search buttons and all that stuff that you can do in digital?
RP: Cool. That’s a big question.
JS: Yeah.
RP: [inaudible 00:17:12] on both sides. Okay, so my personal background is not in print. So the newspaper is definitely a print, first and foremost, but I came in on the digital side, and I haven’t really had to do anything on the print side. I do love those poster type pieces, I mean, those beautiful pieces that come out of the National Geographic or The New York Times. You just can’t deny they are nice to look at, and you want to spend time with them looking through them. I am a book lover, so I love having a book in my hand, and that tactile feeling, but also, I’m a millennial, so I’m not like Gen Z. I need to understand that I’m starting to get on in the world and that’s not the experience of the next generation, like, they don’t know that.
JS: Yeah.
RP: So I don’t know how they’re going to – I don’t know if they’re going to have the same nostalgia for this kind of tactile experience. So then, I guess, moving towards digital, yeah, I’m excited about it. So I just – the possibilities are endless, which is really daunting and really challenging. But when you get it right, it’s super exciting. And the other thing that I wanted to touch on a little bit about what you’d said, sort of, for Asia to come into this scene now, it’s really nice to have technologies like what, you know, [inaudible 00:18:48] and Observable are doing. They’re making it accessible for people from all backgrounds to kind of start, like, Plotly and things like that, to be able to start using three or like, even having tools like Flourish, or, I believe, the Continentalis actually uses Flourish for a lot of their storytelling visual. So there’s a lot more tools now, and there’s a lot more flexibility in terms of actually producing these types of stories, and I think it’s allowing new voices to come through from Asia. Another point on that, which I’m super thrilled about is the Myanmar situation. So in the recent coup, it was an incredible reflection of the efforts in data storytelling and data journalism and data tools, because I know a few people there that have been training up journalists there. And there are some incredible resources that they are putting out about deaths or protest areas and things like that, but proper datasets with APIs, you can pull from the APIs, and you can – this would not have happened at the last, you know, without them opening up a little bit and then having all of these tools at their disposal. It’s really nice to see them being able to kind of produce all this data content, and it’s having an impact in getting it out to the rest of the world. So yeah, that’s helpful, all this kind of, the tools that the Western people are building for the rest of the world is super helpful.
JS: Right. So it’s really democratizing data, and DataViz, yeah, it’s sort of this international way that maybe many folks who are using it or some folks, at least, who are using those tools, may not necessarily realize. Right? Because I think a lot of people are excited about Observable and Flourish and Datawrapper and other tools, because it makes, hey, I don’t need to know how to code but I can make a bar chart race – not that anyone is making bar chart races anymore, but I can make a bar chart race without having to actually learned how to code. But there are bigger implications of those tools for actual news stories, reporting news stories, yeah, that’s…
RP: Exactly.
JS: Yeah. So I want to talk about this gerrymandering piece. And so, maybe, I mean, it is amazing to me that you had someone sit down and draw these by hand. So maybe you could describe that piece a little bit, and the question that I wanted to get to, I’ll just preface this, so you could talk a little bit about that, so as you scroll through this piece – and again, I’ll put the link in the show notes – you get to the end, where you can type in your address. And this is a technique that lots of people use, and I’m curious on your take of like, how important that is that that last aspect of like, you can make it super personal, as opposed to you get to the story, you can see these examples, and then you can say, okay, what about me personally.
RP: Yeah, I think it’s something we probably haven’t nailed yet. So that, I don’t even think looking back, would I do it the same way now, I don’t know. Obviously, having the personalization element is going to be good for a story like that one, because our audience is Singaporean, so mostly Singaporean, I think, like, 70-80% Singaporean. So this is a very hyper-personal story. So gerrymandering is a contentious issue in Singapore, and it’s been dealt with, but in various different ways, and nothing like this has been done before. And I was a little bit worried about producing a piece like this, and whether we [inaudible 00:22:53] able to publish it. I mean, let’s be honest, Singapore does not have the best track record in terms of media freedoms. And we work for the Straits Times, and it also doesn’t have the best track record, and that is where data really plays a fantastic role, because they could not publish a piece like this, because it was – this is just, we just hand-drew everything that’s available, and we made it into a map that you can then search. And we try to make [inaudible 00:23:24] big conclusions or try to make any sort of big political statements. It was just this is the data, and this is the maps, and this is what it represents, and that’s it. So very, very dry as much as possible. I mean, I don’t know. That’s what I think the data, I mean, I think it was an option, so maybe we could have done in a less obtrusive way than what we did, because we can skip it, and then get to the rest of the piece that then…
JS: Right.
RP: Yeah, I don’t know.
JS: Yeah, I mean, I didn’t find it obtrusive, because it kind of came towards after you got through the lead of the story. And you can see this a lot, and I just, you know, I mean, there’s a lot of different stories where people do similar sorts of, you know, here’s a story on housing prices, and now you can put in your zip code and see your housing price. And I think we all know that personalization is important, but I wonder, like, how important it is, and whether people actually use it and, you know, the importance of mobile and are people using it on their mobile devices. So yeah, I was just curious on how you think about all that.
RP: Yeah, I actually can’t remember now, if we tracked that – we were tracking how many people actually clicked on it. But I do remember we got feedback from the community, and they were super keen to see what had happened to their – the funny thing about Singapore is that basically you’ve changed constituency almost every single election, wherever you are. It’s very common. So that’s why we focused on how many times your constituency had changed, yeah, because a lot of the times that people will be like, oh, I got five times it changed or, like, three times it changed…
JS: Oh, yeah.
RP: So it became like a competition in a way.
JS: Right. That’s interesting.
RP: I mean, we need that going in. Well, Singapore is small, at the end of the day, and I do have a funny story to tell about this one. So we were in the office, pre-COVID, and we were discussing our election coverage, and I had this huge wall set up with all my post-it notes of like, all the projects we were going to do, and one of them just had – it was a post-it note and it just said gerrymandering across it. And I’m sitting there talking with my team – obviously, I knew it wasn’t going to be gerrymandering, it was going to be something a little bit more data heavy – sitting there talking with my team, and then all of a sudden, I look up, and there is being vice, the Deputy Prime Minister of Singapore, and a few of the other senior MPs had come on a tour into the newsroom. And I had no idea that this is happening, and they’re looking around and they’re talking to me. And then they saw, of course, my post-it note that said gerrymandering, and they just all started laughing. And I was like, oh no, I am on the blacklist right now, I’m moving out of the country. I’ve never been so embarrassed. I just wanted to hide.
JS: Wow.
RP: Yeah, and thankfully, they were very nice about it, and the deputy prime minister, he was like, you know, they just need that, they’re journalists, they need to do their job, let them do their jobs, and [inaudible 00:27:00]
JS: Well, that’s good, yeah, that’s good.
RP: It went by and we ended up publishing it, and my editor in chief was there during the whole incident, and I even have a photo of the event, I can share with you later.
JS: That is terrific. That is a great story. That is great.
RP: Yeah.
JS: So I want to, before we close up, I know you’ve been doing a master’s degree, and so, I’m curious to hear about that, and what you’ve been doing sort of like personal projects, and especially, during COVID, we’re all sort of locked in, like, has that been – you’re in a master’s program, which is hard enough on its own, but you’re also doing like, what I would guess, would be like more personal projects, so has it been like this sort of mix, this weird mix of like, I’m working, like, I’m a student and I’m working, but I also get this outlet to do personal things that maybe you didn’t have the opportunity to do or the instinct to do before actually diving into all of it.
RP: Yeah, absolutely. So yeah, I just recently completed the master’s in visual tools at the University of Girona which is organized by Xaquín González Veira. He’s quite famous in the community, he worked for The Guardian and the New York Times and Nat Geo, and he put together this master’s program, which is unlike any master’s program, I think, that exists on the planet, which is very shocking, and his foundation.
JS: Yeah.
RP: We started off in October last year, we finished in June, so it was quite intensive. And the first, the first block of modules was D3, Python, open data engineering and statistics. And we did that, like, consecutively, we had to produce a project that used all those three elements, and I did not code, I’m not a coder at all, I’m a journalist by training. And it was just really good to get my hands dirty in code, and I finally feel a little bit more comfortable now with actually just giving it a go and trying it out. I’m nowhere near like a [inaudible 00:29:21] but I’m now not so scared, which is nice.
JS: Yeah, that’s good, yeah.
RP: Yeah. Then the second block was ethics with Xaquín’s module on the creative side of things and also mapping. And for the Xaquín’s particular subject, we ended up having to do what was called 60 days of data. So we had to collect 60 days of personal data, and then produce something out of that, and I ended up going with – I was inspired by an academic paper on turning dance into data, dance movement called Laban movement analysis, and I had no idea that you could do this at that point. I used to be a dancer as a kid, I was always dancing. I danced my whole life basically. And I went into work and I became a mom, and then I stopped dancing, and then I had this opportunity where I could marry the two together, like [inaudible 00:30:24] and dancing, and I was like, I have to try this, I don’t know if it’s going to work. And that was kind of the beauty of doing the master’s program was that it didn’t have to be like a fully finished published projects for an editorial paper, it could be, if it failed, well, it failed.
JS: Yeah, right.
RP: Yeah, so it was really nice to have that freedom.
JS: Yeah.
RP: So I ended up doing like 60 days of my mental health, and then translating that into data moves, and presenting that as a data piece, and was, I think the most freeing experience I’ve had. I could marry this data side of me, this logical, factual side of me with also the freedom of movement and dance. And the really nice thing about it was that I found out that if you dance and you sing, it actually helps improve your mental health. So my recommendation at the end of that was all of us in lockdown just get up and move and shake your body, and let it be free and sing, and you may feel a little bit better.
JS: Yeah. Well, that’s an awesome way to finish this interview, so a very positive, uplifting message.
RP: Dance with your data.
JS: Yeah, dance with your data, yeah, that’s so great. That’s a T-Shirt waiting to happen. So I’ll put the link to that project up on the show notes so people can check it out, and it’s got videos of you sort of, you know, clips of you dancing next to each of these little pieces. So it’s a really fun project that people should check. Rebecca, thanks so much for coming on the show. This has been really fun chatting with you and learning all about the work you guys are doing over there.
RP: Thank you so much for having me. I hope we can talk soon.
JS: Yeah, I hope so.
RP: In person maybe one day.
JS: Yeah, in person maybe, that would be great. Thanks.
RP: Yeah. Okay.
And thanks to everyone for tuning into this week’s episode of the show. I hope you enjoyed that. Hope you learned a little bit about the work that Rebecca is doing. And I hope you’ll check out the Straits Times works. Try to check out some of these international newspapers that maybe you’re not as familiar with checking out. Personally, the ones that I check out, aside from the Washington Post and The New York Times I basically read every day, because I’m located on the east coast of the US. I also try to read the Chicago Tribune, I try to read the Los Angeles Times, both of which have some really good data visualization teams going on. I also check out the Berliner Morgenpost, the Hindustan Times out of India, Straits Times, and a bunch of others. So please feel like you should check out these other organizations around the world because they’re doing incredible work, and sometimes don’t get the credit that they deserve.
Well, I hope you enjoyed this week’s episode of the show. Check out the show notes. Consider writing a review of the show on your favorite podcast provider. And if you’d like to financially support the show, check out our Patreon page, or check out PayPal, where you can just make a one-time donation. So until next time, this has been the policy of his podcast. Thanks so much for listening.
A number of people help bring you the PolicyViz podcast. Music is provided by the NRIs. Audio editing is provided by Ken Skaggs. Design and promotion is created with assistance from Sharon Stotsky Ramirez. And each episode is transcribed by Jenny Transcription Services. If you’d to help support the podcast, please share it and review it on iTunes, Stitcher, Spotify, YouTube, or wherever you get your podcasts. The PolicyViz podcast is ad free and supported by listeners. If you’d like to help support the show financially, please visit our PayPal page or our Patreon page at patreon.com/policyviz.


