Michael Freeman is a Senior Lecturer at the University of Washington Information School, where he teaches courses in data science, interactive data visualization, and web development. Prior to his teaching career, he worked as a data visualization specialist and research fellow at the Institute for Health Metrics and Evaluation. There, he performed quantitative global health research and built a variety of interactive visualization systems to help researchers and the public explore global health trends. Michael is interested in applications of data science to social justice, and holds a Master’s in Public Health from the University of Washington.
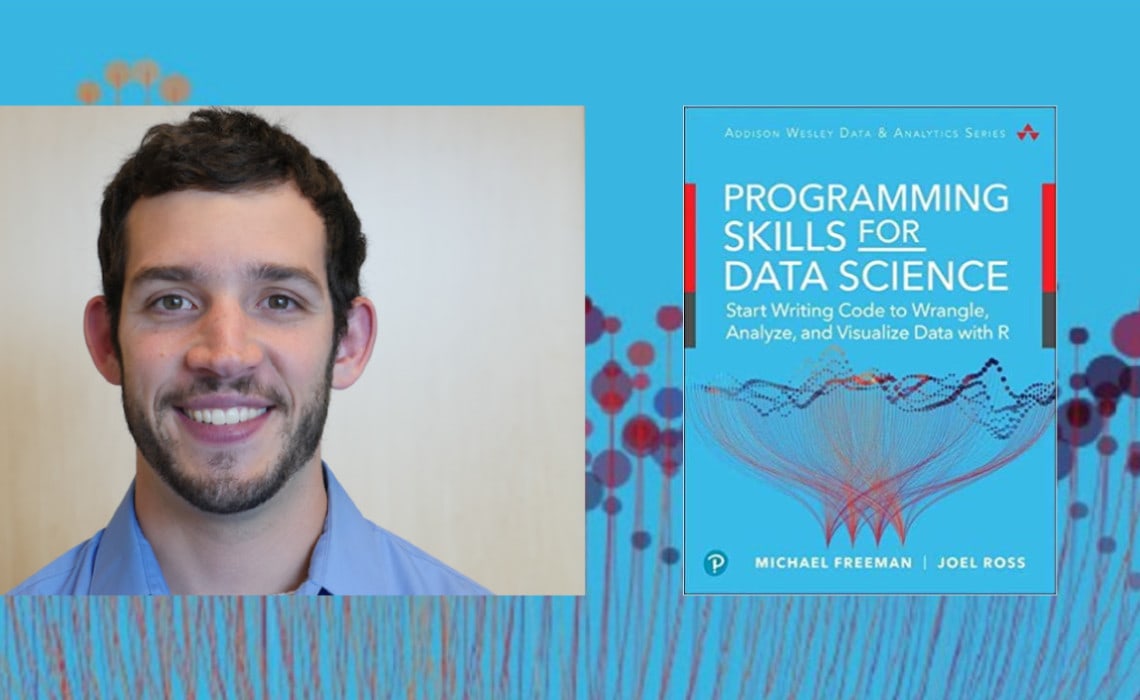
In this week’s episode of the show, we talk about the new book Michael wrote with Joel Ross, Programming Skills for Data Science: Start Writing Code to Wrangle, Analyze, and Visualize Data with R. We talk about how he uses R and other parts of the data science ecosystem, like Github. We also talk about how he teaches R in his classes at the University of Washington.
Episode Notes
Programming Skills for Data Science: Start Writing Code to Wrangle, Analyze, and Visualize Data with R | Book exercises and in-action sections on GitHub
Transcript
Welcome back to the PolicyViz Podcast. I am your host, Jon Schwabish. On this week’s episode, we are going to talk about R and we are going to talk about how to learn R. And to help me do so, I sat down with Michael Freeman who is a lecturer at the University of Washington Information School out in Washington State. He and Joel Ross have just published a new book called Programming Skills for Data Science: Start Writing Code to Wrangle, Analyze, and Visualize Data with R. So Mike and I sit down and we talk about how he uses R. We also talk about other parts of the data science ecosystem like GitHub which is a pretty sizable fraction of the book, which I think is a great addition to the general books that are out to date that talk about how to use R and how to code in R which is obviously a subject in and of itself, but also how to share code, how to use some of these other tools and platforms that are out there. We also spend a little bit of time talking about how Mike teaches R in his classes at the University of Washington. So it’s a really interesting discussion, and of course before I get over to the interview, just another reminder, if you’d like to help support the show, please consider becoming a Patreon supporter or reviewing the show on iTunes or your favorite podcast provider. All those are really appreciated to help others learn about the show and listen to the show, and of course to help the financial needs I have for the show to help with the audio editing and the transcription services and all the other good things that I need to help bring the show to you every other week. So there’s a few new episodes I’ve got coming up in the next few weeks, I’m really excited about some of the guests I have. I’m branching out a little bit into areas that are associated with data visualization and communicating, so I’m really excited to bring you some really fun guests that I’ve lined up. So here we go. This is my interview with Michael Freeman, senior lecturer at the University of Washington Information School.
Jon Schwabish: I’m here with Mike Freeman who is a senior lecturer at the Information School at the University of Washington who has a new book out, Programming Skills for Data Science: Start Writing Code to Wrangle, Analyze, and Visualize Data with R. Mike, how are you? Welcome to the show.
Michael Freeman: I’m doing great. Thanks so much for having me Jon.
JS: It’s been a while since we chatted last, I think, was it OpenVis?
MF: It was at OpenVis.
JS: Yeah.
MF: So yeah, many months have passed.
JS: Many months, and since that time you have a whole new book out.
MF: I do. I thought I was nearly done with it last time we spoke and now I’m surely truly done with it. I can hold it in my hand [inaudible 00:02:42].
JS: Before we get into the book and talk about the book, maybe you can talk a little bit about yourself and your background and maybe also your beginnings with R to sort of set the stage for folks so we can talk about the book.
MF: That sounds great. I am a senior lecturer, as you said, at the Information School. If you’re not familiar with one, it is where one would learn the skills for working with information. Historically, that was a librarian degree, a Master’s of Library and Information Science, and the modern version of that or the incarnation of that is an Informatics Degree targeted at undergraduates where they learn the skills for working with information that incorporates data science, user experience design, and a variety of other courses that intersect with how people, information, and technology intersect. There, I teach courses in programming, data science, web development, and data visualization, and have a lot of fun with all of those. And the way that I’ve come to this is my background is actually in public health, I have a master’s degree in public health; and just about everything I learned, I learned when I was working at a global health research center called the Institute for Health Metrics and Evaluation which is part of the University of Washington. I hadn’t written a single line of code before I got there. I studied sociology as an undergraduate and was shocked to learn that studying global health quantitatively wasn’t just sitting around and thinking about it but involved writing a lot of code; and most of that, while I was there, I worked a little bit with Stata [ph] or Stata, we can have that separate debate later, and some of that was in Python, and some of that was in R. And I had a really challenging time figuring out the different environments and how different things fit together, and just getting started writing code to work with data was something that took me a long time, I didn’t come by it so naturally, I didn’t start writing code when I was 13. And a lot of what is in this book is the set of things I wish I knew when I started working in this research and analyst or quantitative analyst role.
JS: So before we go on, I want to make sure that folks know that you co-authored this book with Joel Ross.
MF: Yes.
JS: So let’s make sure we give him props. So he’s also at the Information School?
MF: Yes. So Joel Ross is also a senior lecturer at the Information School, couldn’t be with us on the show today, but he is a fabulous instructor and writer, a really great educator and it was truly a delight to work with him. Coincidentally, we went the same undergraduate college, Colorado College, though we weren’t there at the same time. But we really enjoyed working together on this book, and I usually point to some of the better sections as the ones that he put together.
JS: So it sounds like from when we’ve talked in the past that this book started as a collection of online tutorials that you two had written I would presume for your students, is that right?
MF: Yeah. So the origin of this was actually for a course that I put together called the Technical Foundations of Informatics, which I often described more publicly as an introduction to an introduction to data science, which was not a book title than anybody liked but I thought it was [inaudible 00:05:58].
JS: Yeah.
MF: But we wanted to ensure that students entering our program had a shared foundation so that they understood the foundations of data literacy and visualization, that they knew how to use different tools like Git and GitHub and their terminal, and also that they knew sort of these overlooked skills like how to use markdown or how to collaborate on GitHub. So we wanted to have that foundation and now we put about a 1000 students a year through that course, but we also wanted to bring this to people that weren’t going to study informatics independently but might do something like minor in informatics and study political science or study sociology. And that has been some of the most interesting cases. Now I have students that come to me and say, “Hey, I’m an international affairs student and I just made a FOIA request for all the deportations by ICE and how do I work with this data?” I think that is an excellent candidate for these skills to programmatically interact with it and generate some really compelling resources using that information.
JS: Yeah, absolutely. So let’s talk about the book. Where does this book, in your view, fit in with the existing library of our books that are out there? I mean, there’s a ton of them, we’re not going to list them, but where does this fit, what sort of gaps in the literature did you guys identify saying, there are certain [inaudible 00:07:15] this book can fill?
MF: That’s a great question, because there are a lot of great R resources and we sure wouldn’t have gone through all of the painstaking process of writing a book if we didn’t think it was worthwhile. I think there are a few things that make this distinct. It’s an introductory book, so it isn’t anything that people need any background. It also has a combination of skills, like, we really believed that if you’re going to start writing code to work with data, you have to know how to keep track of that code, and you have to be familiar with the tools for navigating your computer, and you need to know how to collaborate writing code. And I don’t just mean emailing a file back and forth with different underscore final, underscore final-final, underscore new final at the end of the tag.
JS: Underscore final V2.
MF: Right, or new final and is that the newer final or the [crosstalk 00:08:01] Yeah. I think we dug into a lot of the pain points. I’m teaching a 150 students right now using this book, and the biggest pain point – installing stuff on your computer, handling different types of errors that arise. So we wanted to cover those skills, we also wanted to have a little bit of the conceptual work in there, so we have a chapter on understanding data, different types of data structures, different types of where the data gets generated through surveys and through sensors. We have a similar chapter on designing data visualizations, which isn’t about writing the code though that’s the focus of most of the other chapters, but brings in some of those best practices and principles so that when you are writing the code you’re generating something that is influential and clear and effective. It also doesn’t go into a lot of the statistical side. So we didn’t want to focus this say on statisticians or machine learning. We think of these as the skills that underlie those different fields because, as we know, 90% of doing data science is data wrangling, and the other 10% is complaining about it.
JS: I do want to get into a couple of things about the book that I find that are particularly interesting, the GitHub section, the R [inaudible 00:09:14] section that I think aren’t really in a lot of the other books. But before we do that, you’re talking about teaching your 150 or so odd students, and I’ve been talking with people a lot lately about learning code, I basically learned R two months ago after putting it off for a long time…
MF: There’s a great [crosstalk 00:09:31]
JS: There’s a guy here, Aaron Williams, who’s Urban’s R leader basically and I said, “Aaron these books aren’t working for me, I don’t have the six weeks to sit down and do them.” So he sat down with me for two full days and we just did this R learning sprint, and that really worked for me. So I’m building up to this question of, when you are teaching your students R what are some of the strategies you use so that they can overcome some of these challenges? Like you said, installing is a big hurdle for people, and I guess you can write here the steps but does that work for everybody? I found it really helpful to sit down with him and say, “Okay, I don’t know how to do this thing, can you help me figure it out?” Like having someone next to you is really helpful.
MF: Absolutely. The book doesn’t do everything.
JS: No, no, right.
MF: We have a bunch of exercises and their solutions online and those are publicly available for anyone, so those are up on GitHub, anyone can look through those. Some students really like to read the solution to something, others like to work through it. But it comes down to having a variety of different techniques. In a two-hour class session, maybe half of that, students are actively writing code, and myself and a group of TAs are walking around and sitting next to students and troubleshooting and also encouraging them to work with one another if you have a question, particularly if you’re packed into the middle of a row, ask the person next to you. We also do a lot of active learning assessment. So I might explain something like how to access a particular row of a data frame. And then I’ll use a poll like an in-person poll and I put up five lines of code and say, “Which one of these lines of code will get the information you’re looking for?” So I actually did an assessment during the class time about whether or not students have absorbed the material yet.
JS: Right. So what’s the ratio of TAs to students?
MF: It’s about 1 to 25.
JS: But yeah that collaborative learning where you have someone sitting next to you who might be able to solve your problem I think is a good point. Okay, back to the book specifically, so you start the book, setting up the computer, like you said, and installing. And then the second part of the book, like, I’m looking at like 20 pages in you get to managing projects. And I think that’s a really important part of the data flow, the data workflow that is missing from a lot of books. So can you talk maybe a little bit about that section of the book and also what your experience is teaching that content, because probably for a lot of people the lingo, the jargon for GitHub is really difficult to get, and so what has your experience been teaching those couple of chapters?
MF: Yeah, so we put the managing projects and version control right at the front of the book, largely because years ago I did a survey of my students and I said, “Could you describe your confidence with programming, no experience, moderate, lots, whatever? And can you also explain your experience with keeping track of your code in version control?” And I think one year 82% of the students in an introductory course said, “I’m a moderate or confident programmer,” and of those 82 percent, I think it was maybe 12% had used GitHub or any other version control system. So that’s akin to saying that you’re a good driver but you don’t know how your seatbelt works. You don’t know how the safety mechanisms are in place. So it is, the first thing we talk about, we actually talk about how to keep track of projects before we talk about the R programming language. And it’s a little tedious and it’s a little abstract, but GitHub is a tool, it’s something that makes it a little bit more satisfying. You can actually write markdown code and then push it up to GitHub and have it be hosted as a website if you configure your branches properly. So that’s something that I think students get excited about, it’s easy to see what that progress is. Certainly, the more complicated aspect of that is working in teams. So before this class existed in upper level, say web development courses, we would just say we’re going to group for this project without spending the one or two class sessions saying what is a merge conflict or how do you have multiple people working on the same project. So it’s something that is one of the more important things about actually working together on a data science project but is overlooked, and for that reason we teach it early, we have them adding committing and pushing every day as part of demonstrating they’ve worked on some exercises. And then later on we have specific exercises and assignments where they work in groups together and work, you know, we force them to create merge conflicts so that they aren’t scary when they happen.
JS: Right, really interesting. So the other question I had for you was, I’m always curious how – obviously it’s a tool book for data and DataViz – but I’m always curious about how people pick the functions that they’re going to highlight. So the book has the tidy verse framework but I’m curious about when you’re going through and you’re writing this book like how do you decide which commands and functions you’re going to include and which ones are going to exclude?
MF: That’s a great question, how do we decide what makes it in, because even though it is nearly 400 pages there’s a ton that isn’t covered.
JS: Yeah, right.
MF: I think it came down to a couple of things. One was just what do we use a lot, right, if you sit down and you grab a dataset and you want to do some analysis, make a report about it, make a variety of charts, what are the skills that you need to create that product at the end, and that often involves reshaping your data which is why there’s a tidier chapter. It isn’t just because I think that gathering and spreading are like cool functions, there were ones that I used and there are ones that are kind of conceptually difficult. I think the idea of the book is it sets people up to then go further, not everything is in it, and if software evolves the way that it should, there will be another set of functions and packages that are important [inaudible 00:15:22] using in a few years that make things easier. But the ones that we selected are really commonly used. We would look around on blogs and Twitter and whatever else to see what people were using to solve problems. But the purpose of doing data science isn’t to write code, it’s to figure out answers to your questions, and these are the tools that we found most often helped us answer questions about really important things. And we have these in-action sections maybe at the back of six of the chapters that take a real dataset and walk through whatever the cleaning challenge is and do it to try and surface really important patterns about anything from police violence to evictions in San Francisco, to things of course that are more lighthearted like finding good restaurants in Seattle. So there’s a balance there but we were selecting these things based on what we thought people needed to know to get the information that they were hoping to produce in the first place.
JS: Yeah. What I find really fascinating about the book is that unlike a lot of the other R books, and like you said, you are never going to be able to capture everything, so this isn’t a knock on any of those other books either, but what you and Joel have seemed to have done is take a lot of the core things of R and branched out just slightly to do things about sharing – and also like, I’m looking at the chapter on Accessing Web API which doesn’t seem to be a big part of a lot of other R books but seems to be one of the big advantages of tools like R and Python that seems to be part of like the new data science, new programming language toolkit.
MF: Yeah. I think so often in university environments people are just handed a dataset, and we found that a lot of times people were trying to use more robust or complex data sources. So we do have a chapter on interacting with databases, we do have a chapter that introduces Web APIs and how to use them and covers of course both the conceptual of what is this thing and how does it work and also how do you then interact with it from the R programming language.
JS: So towards the end you have the last section, the sixth section is on building and sharing the applications where you talk about R markdown, Shiny, and some other collaborative tools. But what is – now you can see I haven’t really read the book cover-to-cover yet, I’ve just been tagging like the things that I need, but like the difference between an R markdown and then markdown?
MF: That’s a great question. You’re now quizzing me to see if I know the material in the book, if I can explain or not.
JS: [inaudible 00:17:48] I can just ramble here for a couple of seconds and [inaudible 00:17:52].
MF: Come on Jon, you should have gone to [inaudible 00:17:55].
JS: I know, yeah.
MF: So R markdown is awesome because it combines the easy-to-use syntax of markdown with the ability to write R code in the middle of the document. If you wanted to write a report on urbanization in Washington DC or what’s going to happen when Amazon joins your city, separate conversation, you could both have the writing that you would do and the headers and the images, but as your calculations change, you could actually inject those figures or numbers or charts based on the data. So you could start with basically a.RMD script where you could write everything in markdown but anytime you want to reference a value you could actually reference an R variable that you’d created and you could have these little chunks of R code that produce your plots or maps and then you can compile that into something like a website, like a.HTML file.
JS: Do you think that that is the future of publishing, especially technical books – I mean, we are seeing more and more books that are already written in markdown or R markdown – is that, do you think the future of I guess things coming together in the publishing world and the programming world and the open source world, is having everything in a markdown document before it actually gets into the hardcover paper version?
MF: That’s a great question. As you had referenced, we made a set of tutorials, those are still online and publicly available and free at info201.GitHub.io, so people can go read something that this book is based off of. Believe it or not, we wrote this entire book in R markdown, and then instead of compiling it to a web document, compiled it to a PDF so that every time we had some sentence that said, the number of times that the word data appears in this book is 482. That was actually a variable, it was counting the number of times in the text. So it was something great for R [ph] interactions, we also did this all using Git and GitHub and version control so we could both work on the book at the same time, and it’s a great way to share information. I think a lot of what publishing a print book meant for us was it forced us to really polish it and really come up with excellent examples. No one wants to read a chapter based on an example of car engine sizes in 1976 [inaudible 00:20:12]. So we would go back and we would revise these and we would look at each state in the United States, what was the proportion they went for the Democrat or the Republican for each national election. And correspondingly, we would, instead of having like weird diagrams that we made using Google slides, we would have these [inaudible 00:20:31] professionally cleaned up and think through them more carefully. And that’s what makes this the next level up from the set of tutorials that we would have online.
JS: So let me switch. I have two questions for you. We’re going to do like love and hate. So let’s start with the hate. What do you hate most about R?
MF: Well, if I hated it…
JS: I am curious, because I’m like two months into my learning curve on R, so I’m curious for someone who’s been doing this for a while like what’s the thing that bugs you the most.
MF: That’s a great question. I mean, I obviously like it enough to write a book about it but you can’t write a book about something and have universally positive emotions about it. As someone that has been using R for a number of years, honestly, the thing that I dislike most about it has nothing to do with the programming language and has everything to do with the question – why are you using the R language? It hasn’t yet reached that level, particularly in the software engineering community of being recognized, like, “Oh you wrote a book about data science, why didn’t you write it in Python?”
JS: Python yeah.
MF: I could have. We could rewrite this book entirely in Python and work with the same data and achieve the same things. But I think R is easier to get started with because of RStudio and some of the tools within that IDE, and it’s a lot more popular in the social sciences which is my background. So I think that is perhaps one of my biggest gripes about using R though, you know, come to me next time, I’m in the middle of a project and I’ll complain about whatever error I’m getting [inaudible 00:22:08].
JS: Well, it’s interesting. There was a little Twitter thread a couple of days ago, and the person – you will have to forgive me because I don’t remember who it was but it was an undergraduate student applying for PhD programs in economics and wanted to know, they had learned R and what else do they learned before applying. And someone said you should learn Stata because this is what all the researchers who are current senior researchers that’s what they use. And so if you’re going to work for a senior researcher as a research assistant, you should know Stata. And that’s interesting because where I am, it’s the same sort of thing, the senior researchers, I mean, my background is in SaaS and Stata but there’s obviously an evolution towards R, and so it will be interesting especially over the next five to 10 years to see how things change and the programming tools that people use evolves.
MF: Yeah, and I think that focusing on free and open source tools is great and also having that shared language maybe isn’t necessary as you go into research or professional environments. I have a friend who’s a professor who said before his undergrad he got great at R, and then his PhD program he got great at Python, and now he’s a professor and he’s great at PowerPoint. We don’t necessarily need to have those same tools because you should be able to translate the types of things that you’re trying to accomplish across different languages.
JS: Yeah, and I kind of feel like Stata, SaaS and R and SPSS, for example, like those seem all clustered relatively close together like JavaScript and Python sort of seem you know more object oriented further away from that core thing. And for me, being able to code in Stata, going to R was not a huge lift because they are similar, it’s just a different syntax, but the philosophy is somewhat similar. And so I agree, just knowing how to code in general enables you to maybe flip back and forth between different languages, just learning different syntax.
MF: Totally.
JS: Okay, so you told me what you hate most about it and you’ve already mentioned a few things that you like most about it. But is there a single thing that really like is the thing you love most about R?
MF: When I’m using it, it is awesome to – like, the Tidyverse is great to use Dplyr and ggplot2 to really expressively talk about what I’m doing. I’m like, oh I’m actually selecting and filtering and arranging, these things are really – yeah they make sense, they’re intuitive and that makes for a really great workflow, really easy to read code. The thing that I like about it the most in terms of teaching is the amount of progress that you can make in a quarter. It is amazing to teach in this environment where you can start by talking about the basics of storing values in a variable, this is something that students have perhaps never encountered before and end with this interactive web application where students have built a live website that is connected to an R session in which they can have interactive maps and multipage websites and all of that is generated using the R programming language. So that breadth of different types of work you can do has made it something that is both really great as a researcher, or as a professional, as someone working with data, but also as an instructor to say, hey, look we’re going to start in the first two weeks, you’re going to be putting the things on the right side of this weird assignment operator into the thing on the left side, and we’re going to be kind of particular about it. And in the end you’re going to take on datasets about where there are mass shootings in the United States and you’re going to create something that exposes these patterns that you find pertinent and important, you’re going to talk about it, and we’re going to move away from the specifics of the language to the importance of the thing you’re working with.
JS: Yeah. So last question for you is, how do you recommend people work through the book, do they go cover to cover, should they flip back and forth between the book and the website for the book? You do this obviously in your class, so what’s your recommendation as people pick this up, like, what’s the best way for them to work through the lessons in the book?
MF: That’s an awesome question. So we have exercises associated with each chapter that are up on GitHub, I think it is github.com/programming-4-data-science, and I’m someone who learns a lot by doing. So what I would do is I would read a chapter and then I would work through whatever set of exercises I found appropriate, but what’s great is those exercises also have their answers. So you can click an easy dropdown menu and switch to what’s called the different branch, the solution branch that has those same exercises with all of the answers to them. So if you’re someone who learned more by seeing an example or by taking something that works and augmenting each little piece of it, that’s what I would do there.
JS: Great. Well congrats to you and to Joel, the new book just came out about, what, a little over a month ago, at the end of December?
MF: Yeah.
JS: It’s packed full. I recommend everybody check it out. Mike, thanks for coming on the show, this has been really interesting.
MF: Thank you so much for having me, always a joy to chat with you, and I appreciate the questions and promotion of the book.
JS: Yeah, my pleasure, thanks a lot.
MF: All right, I hope it helps you learn R in the next couple of weeks.
JS: I’m working on it, I’m working on it. Now I’ve got more to do here, but yeah, I’ve got more to do. All right. Thanks man.
Thanks everyone for tuning in to this week’s episode. I hope you enjoyed that. I hope you learned a lot. And I hope you’ll check out Mike and Joel’s new book. The link is on the episode show notes. You should really check it out. I’ve been making my way through it as I’m making my way through a few other R books as I’m trying to become better at R myself. So I hope you enjoyed this week’s episode, so until next time, this has been the PolicyViz Podcast. Thanks so much for listening.
Support the Show
Become a Patreon supporter or review the show on iTunes or your favorite podcast provider.


