
Tile Grid Waffle Chart Map in Excel

The ONE Campaign published a Tile Grid Map of Africa a couple of weeks ago in their new feature on how the internet can help end extreme poverty. The map is really interesting because it combines a Tile Grid Map…

The ONE Campaign published a Tile Grid Map of Africa a couple of weeks ago in their new feature on how the internet can help end extreme poverty. The map is really interesting because it combines a Tile Grid Map…

Maybe the most common data visualizations to show election results are maps. Maps, maps, maps. People love maps. The challenge with maps related to elections, however, is that they don’t always accurately present the results. In the simple and oft-repeated…
The “On…” series is a collection of short blog posts relating to data visualization, economics, presentation skills, or data communication. In each, I discuss an issue, concept, or idea that I have not fully developed, a work in progress, or…

A few years ago, I had a slew of meetings all in a row where different people kept asking me to help them make a map. “I have some state-level data,” they’d say, “can you help me make a map?”…

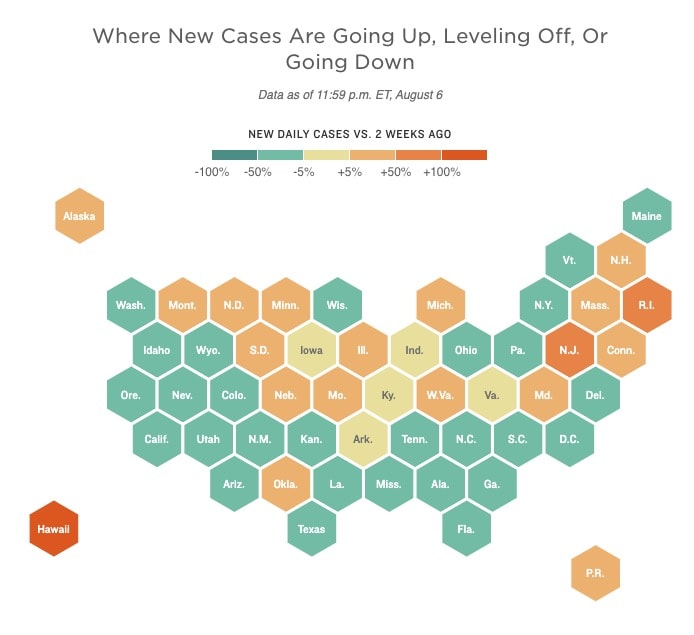
I saw this interesting post from Len Kiefer yesterday about creating a Pixel map of the U.S. using R (which he based off this blog post by Colin Fay). While tile grid maps and hexagon maps address some of the issues…

On Wednesday and Thursday, the Urban Institute published two posts on gun violence in America I co-authored with a colleague (post #1 and post #2). One of the data visualizations in the first post was inspired not by the issue per se, but by…

This is a guest post from David Napoli, a BI & Analytics Director (and recovering rocket scientist) who has worked as lead actuary, statistician, and headed up analytics departments for several healthcare organizations over the last 20 years. In a…

In today’s Data at Urban blog post, I detail my ongoing Data Physicalization at Urban (what I call “DPAU”) project with my colleagues at the Urban Institute. This page provides updated descriptions and photos from the weekly project series. If…

View on Zencastr Creating data visualizations in the physical world is not a new phenomenon. Humans have been drawing on walls, tallying money and crops, and carving on stone tablets for thousands of years. Today, though the practice of data…