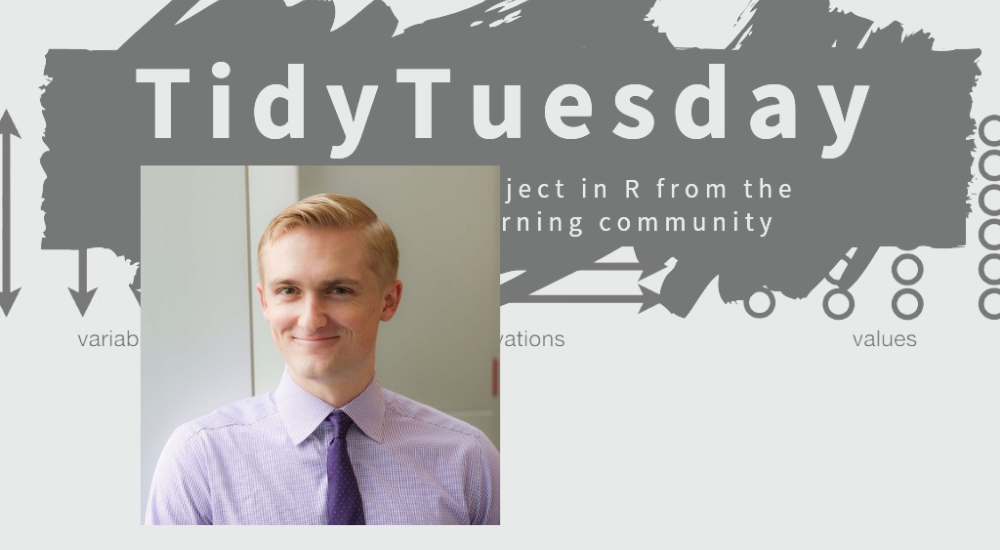
Episode #207: Tom Mock
Tom works at RStudio, and is obviously very active in the R community. He runs the TidyTuesday project and developed the Grammar of Tables package in the R programming language.
Continue readingTom works at RStudio, and is obviously very active in the R community. He runs the TidyTuesday project and developed the Grammar of Tables package in the R programming language.
Continue readingLeland Wilkinson is Chief Scientist at H2O and Adjunct Professor of Computer Science at the University of Illinois Chicago visits The PolicyViz Podcast to discuss The Grammar of Graphics, coding, and much much more.
Continue readingUPDATE: Here are a list of R-related resources from today’s sprint: Colors in R R for Data Science Big Book of R Data Visualization: A Practical Introduction Cedric’s Github repo for the Sprint Cedric’s slides from the Sprint Do you…
Continue readingMike Bostock is the creator of D3, a popular open-source JavaScript library for visualizing data and Observable, an open-source notebook for exploring data and thinking with code. Previously, Mike was a graphics editor for The New York Times, where he helped produce a…
Continue readingLike color, choosing a font can be a difficult decision for even the most seasoned designer. As one who is definitely not a typographer, I will usually seek help from others to guide my font selection. Given that I’m usually…
Continue readingWelcome back to this, the 150th episode of the PolicyViz Podcast! With four years of episodes (almost to the day!), I’ve had a lot of fun bringing you insights from people all across the globe doing amazing work in the…
Continue readingWelcome back to the show! There are lots of decisions to be made when it comes to creating a data visualization. And when you pull multiple visualizations together into one view, the decisions compound. That’s why on this week’s show,…
Continue readingUPDATE (4-9-2019): Along with Jon Peltier from PeltierTech, Inc., I have released a new Excel add-in that you can purchase and customize. You can read more about it at The Chart Styles Excel Add-In blog post. Data workflow issues are…
Continue readingWelcome back to the PolicyViz Podcast! As I’m sure you’re aware, data visualization tools are a regular source of discussion: Which tools to use? Which one is best? Which one allows me to do this or that or the other?…
Continue readingOn this week’s episode of the show, I’m excited to chat with Xan Gregg, Data Visualization Development Director for JMP at SAS (see below). Xan regularly creates visualizations and makeovers for all sorts of interesting topics, as well as, of…
Continue reading