in Tutorials
Marimekko Chart in Excel
November 30, 2015
3 Comments
11202
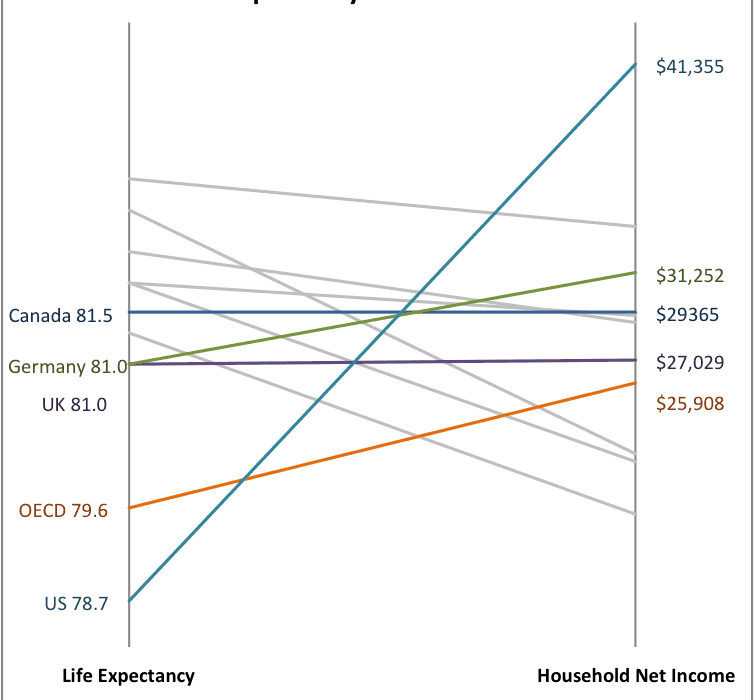
Marimekko charts encode two variables: one along the height of the vertical axis and another using the width of the bars or columns. This one from The Economist, for example, has GDP per capita ($) on the vertical axis and…
Continue reading