The “On…” series is a collection of short blog posts relating to data visualization, economics, presentation skills, or data communication. In each, I discuss an issue, concept, or idea that I have not fully developed, a work in progress, or just some thoughts about a topic or issue I’d like to share.
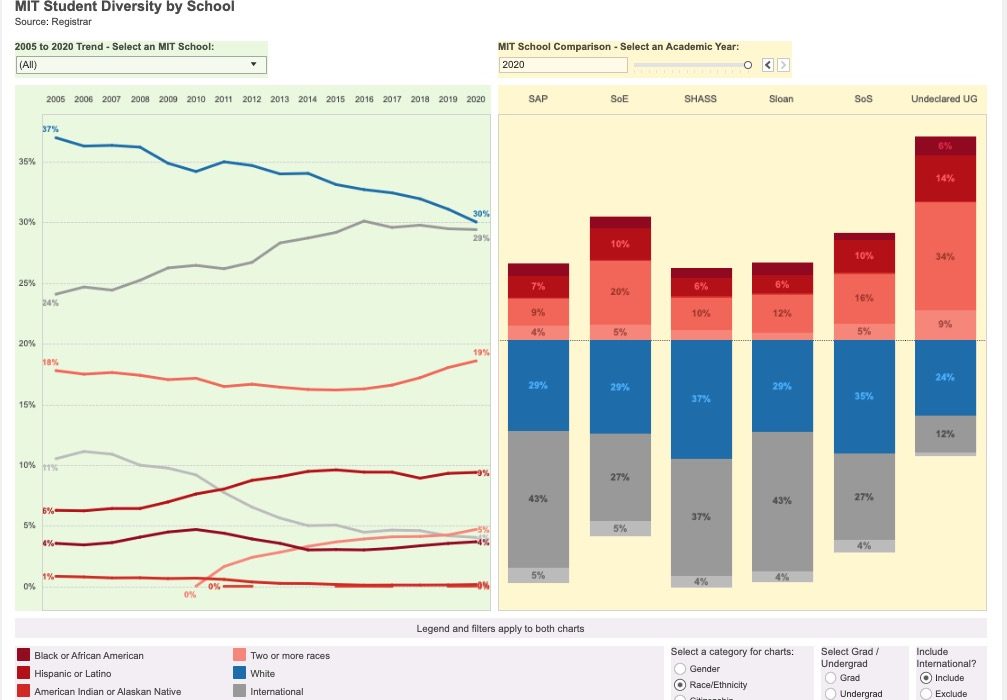
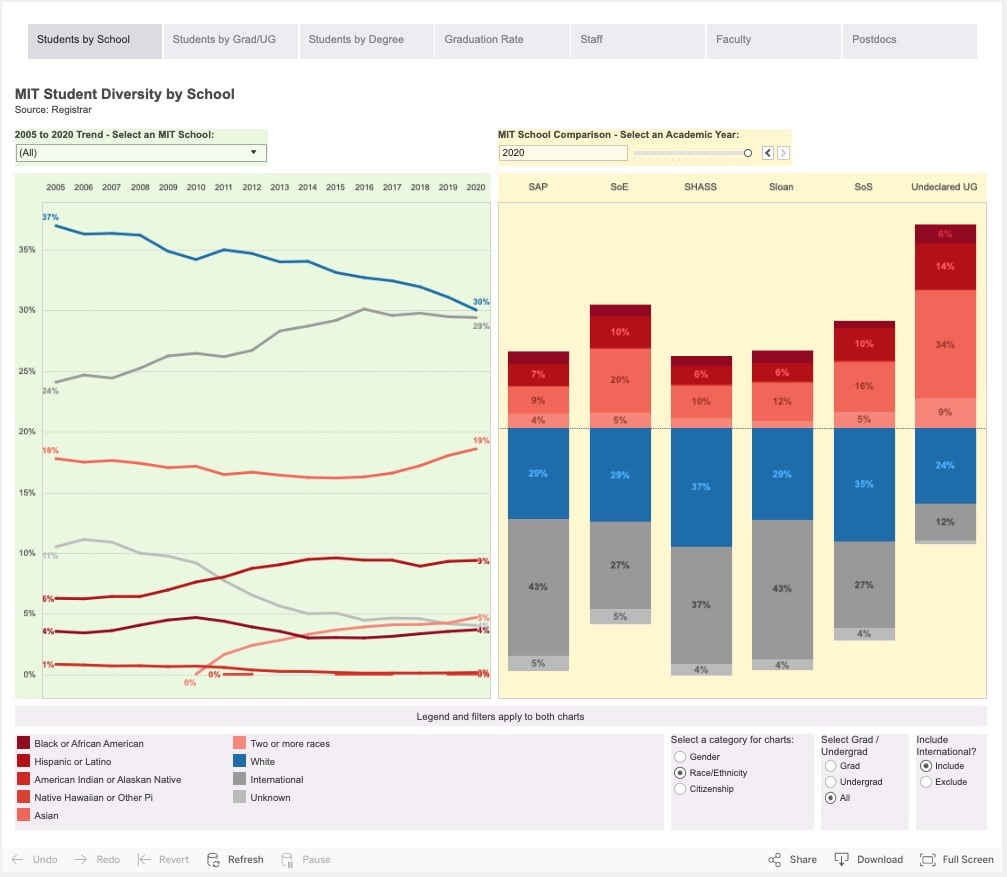
Take a look at this screenshot from this Tableau dashboard published by the MIT Office of the Provost.
Notice anything weird about the legend? Let me zoom in:
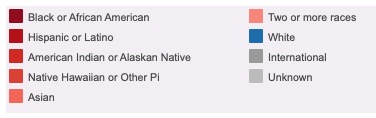
For five of the distinct race/ethnicity groups, they have used five shades of red; a similar lighter pink color for the “Two or more races” category; two shades of gray for the “International” and “Unknown” groups; and blue for the “White” group.
What’s wrong with these color choices? First, these are all independent groups, so a categorical color palette is more appropriate. (Note: I’m assuming these are independent groups and that respondents who did choose more than one group were placed in the “Two or more races” category, or that was a distinct possible answer in the survey.) Second, the red color ramp for the five groups on the left side of the legend “others” those groups. So while the gray colors tend to fade to the background and the reds are grouped together, the “White” category then moves to the foreground and is highlighted, as if that is the norm and to which all other groups should be compared.
Also notice that the visualization is a vertical diverging bar chart with the people of color categories above the horizontal axis and the other groups below. If the intent was to compare White people to the people of color category, there are better ways to do so. I, for one, kind of like diverging bar charts (others don’t), so I might use a 100% stacked bar chart with distinct colors for each group, and then use labels or annotation to help make the comparison. Another alternative would be waffle charts or even just a paired bar chart.
I found this dashboard through Evan Peck‘s twitter feed. MIT responded to his initial tweet:
For those that only run across this through my tweet, @MITDiversity quickly posted a response: https://t.co/iZwHDyy53j
— EvanMPeck (@EvanMPeck) June 16, 2020
I’m not entirely sure what MIT’s response is supposed to mean. We can be “data driven” but we can also be sensitive to how our colors, labels, and other elements of our visualizations are perceived and, ultimately, used by others.
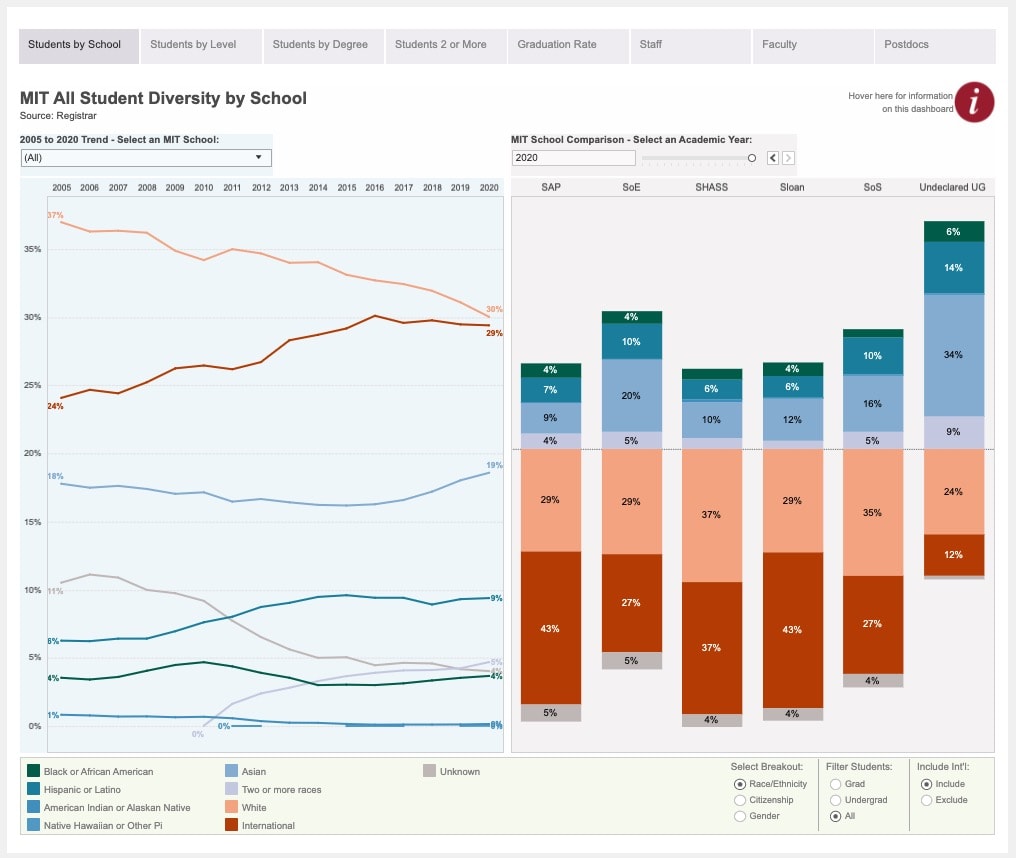
UPDATE: July 23, 2020: It appears MIT has updated the color palette in the dashboard. There are now more distinguishable colors by race. Go over and take a look for yourself!


I found it difficult to distinguish the different shades of red lines in the line chart.
I was distracted in the stacked bar chart, knowing that the different schools (different stacks in the chart) at MIT have much different populations.
In general, treating Unknown and International as their own monolithic categories is strange. I guess we can mentally remove them and guesstimate the composition of the US student population.