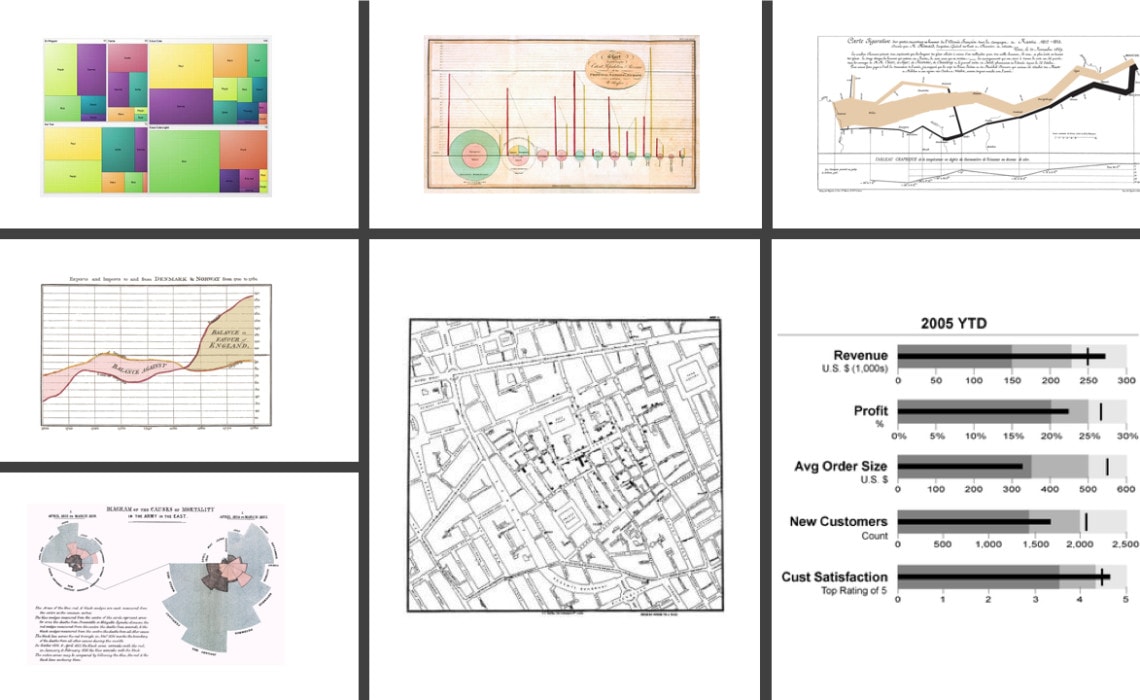
I’ve been making my way through Sandra Rendgen’s new book, The Minard System: The Complete Statistical Graphics of Charles-Joseph Minard. It’s a wonderful journey through Minard’s work and in particular, his development of the flow map. While Minard is generally known for his flow maps, especially his Napoleon map, Rendgen argues that engineer Henry Drury Harness actually created the first flow map in 1837 (relating to railroad traffic in Ireland).
As I read Rendgen’s book, it became clear to me that I’m not exactly sure who invented a lot of the graphs we use today. William Playfair is credited with inventing a lot of our most common graph types like the bar, pie, and line chart, but who invented the Word Cloud or the Bump chart?
Some are easier—the Venn Diagram (John Venn), Sankey Diagram (Matthew Henry Phineas Riall Sankey), and the Gantt chart (Henry Gantt)—are named after specific people. Of course, it’s also possible that John Venn didn’t create the first Venn diagram, but he got credited with it.
In an effort to build a catalog of data visualization inventors, I’ve created this Google Sheet with a list of graphs (based on my Graphic Continuum project) and their inventors. I’m inviting you to help me fill in this list with more graphs, inventor names, and sources. I’ve filled in a few, but there’s a ways to go (and for some, I’ve just listed a random website or Wikipedia).
I’m sure others know more much more about the history of data visualization than I, so I’m optimistic we’ll have a nice catalog here. I’ve also added a sheet for you to leave your name and email address so I can send you updates when it gets filled in.


