When I teach data visualization in Excel, I always show Excel’s Data Import tool. This is a really powerful tool because it allows you to quickly and easily read in data from a variety of sources such as CSV files, text files, or database files.
Surprisingly, I find that many people don’t know about this feature in Excel. A person’s usual workflow might look something like the following: read some data into a tool (e.g., R, SAS, Stata, SPSS, etc.), do some analysis in that tool, and then copy and paste the results from the screen to Excel. The main problem with this approach is that it is not replicable–if your code changes or the data changes, you have to copy and paste the results again, and that’s how errors happen.
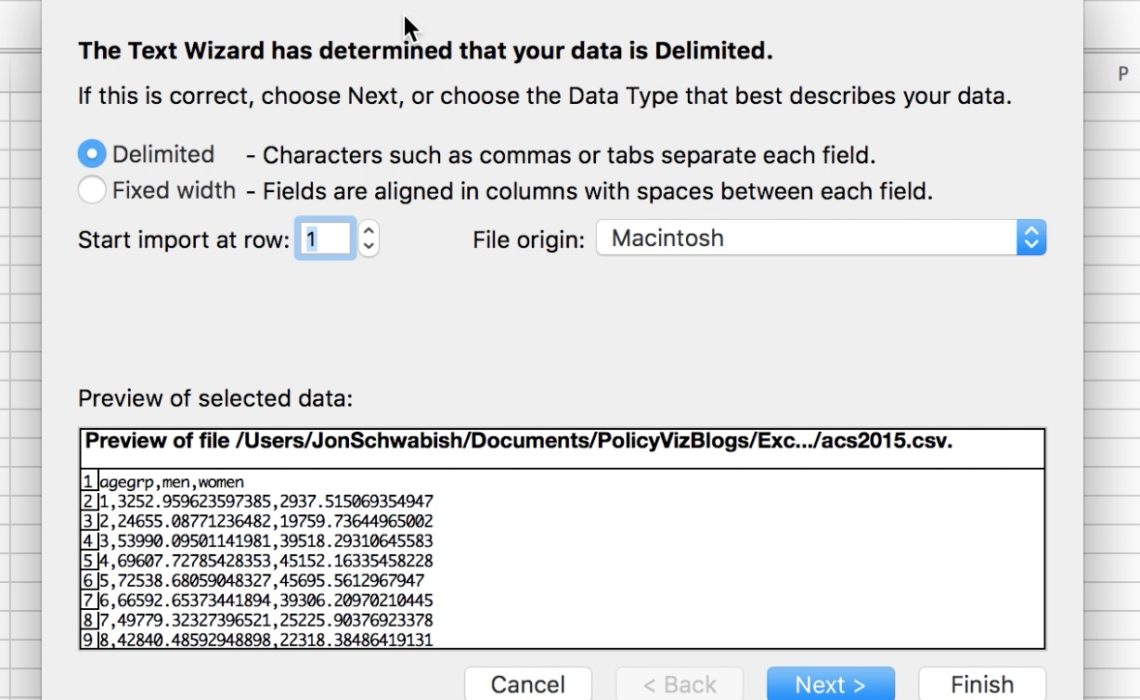
Instead, I encourage folks to use Excel’s data import feature. This tool allows you to link Excel to the file, which you can then update down the road. It’s not foolproof, especially because Excel doesn’t always remember where the original file is, which is why I often add a note to myself in the worksheet with the name and path of the file I’m reading in.
To demonstrate, I created the following video to show you how I approach this kind of task using data from the 2015 American Community Survey (pulled from IPUMS) and piping the results into Excel.
I hope this is helpful and please let me know if you have any questions or comments!


