Last week, Justin Wolfers from the University of Michigan posted a tile grid map to Twitter. Because he tagged me in the tweet, I thought he had used my Excel template. Instead, he built a script in Stata that creates a separate line graph for each state and then pulls them together into the map layout. You’ll also notice he includes a legend and scale using around Alaska, which I think is a nice addition.
Hang on, this one’s adds a legend and a scale.
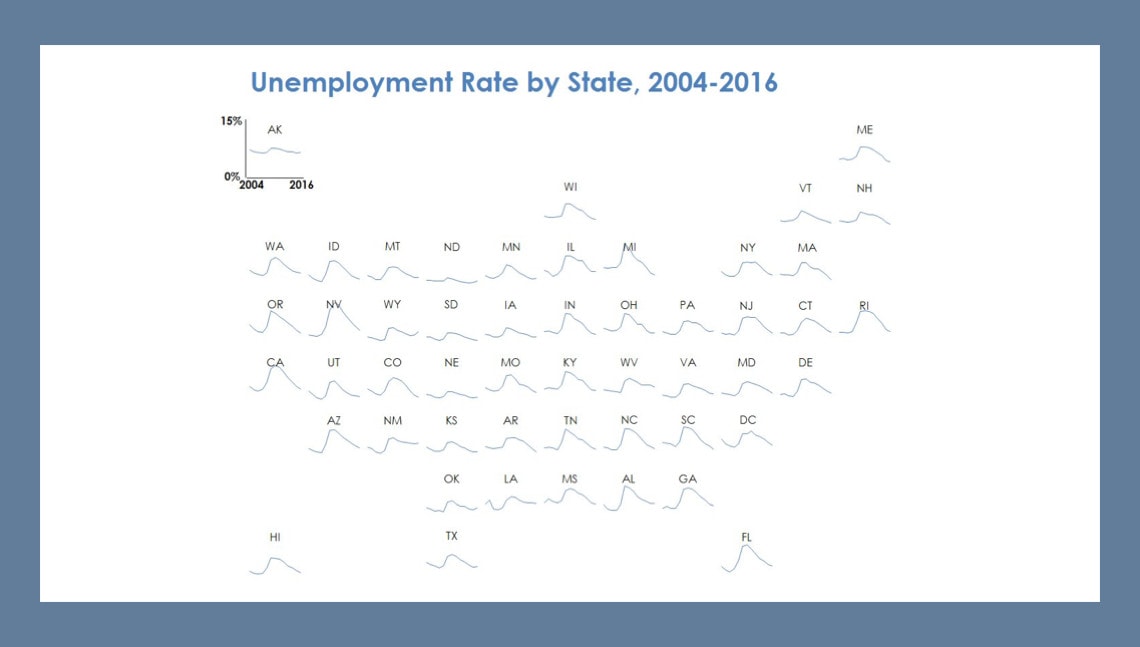
Makes a strong case that the business cycle truly is a national phenomenon. pic.twitter.com/KTyba1JAAl
— Justin Wolfers (@JustinWolfers) May 30, 2017
The code is fairly simple and proceeds in 4 main steps:
-First, within the loop that will create the graphs for all states, he pulls in data from the Federal Reserve Economic Data (FRED) at the St. Louis Federal Reserve Bank database and limits it to the defined timeframe.
-Second, still within this loop, he creates a line chart for every state, which are named for each state, and which Stata then holds in memory.
-Third, he exits the loop and creates a separate graph for Alaska where he adds the x- and y-axis labels.
-Fourth, he pulls the individual graphs together using the –graph combine– command. There are a couple of things going on in this command. First, States cycle across the 11 columns and down the 8 rows in order, placing the state graph in each slot; this is why you see the states ordered as AK, ME, WI, VT, NH, and so on. Second, the –holes- argument tells Stata which positions to leave blank. Starting with Alaska and going right, you leave the 2nd-10th positions blank, put Maine in the 11th position, leave the 12th-16th positions blank, and so on.
You can find Justin’s Stata code below that you can grab, use, and modify for your own purposes.
Thanks to Justin for sharing the code and creating the visualization.
ssc install freduse
global series UR
global start=mdy(1,1,2005)
global end=mdy(12,31,2017)
global states "AL AK AZ AR CA CO CT DE DC FL GA HI ID IL IN IA KS KY LA ME MD MA MI MN MS MO MT NE NV NH NJ NM NY NC ND OH OK OR PA RI SC SD TN TX UT VT VA WA WV WI WY"
set scheme s1color

foreach s of global states {
                freduse `s'$series, clear
                keep if daten>=$start & daten<=$end
                twoway ///
                                (line `s'$series daten, color(blue)) ///
                                , ///
                                ti({fontface Century Gothic:`s'}, ring(0) pos(12) size(*2)) ///
                                ylabel(none) ytick(0(15)15, notick) yscale(off) ///
                                xlabel(none) xtick($start $end, notick) xscale(off) ///
                                xtitle("") ytitle("") ///
                                plotregion(style(none) istyle(none) margin(zero)) graphregion(style(none) fcolor(gs15) istyle(none) margin(zero) ) ///
                                xsize(1) ysize(1)  ///
                                name(`s', replace)
}

* Make Alaska the legend
freduse AK$series, clear
keep if daten>=$start
twoway ///
                                (line AK$series daten, color(blue)) ///
                                , ///
                                ti({fontface Century Gothic:AK}, ring(0) pos(12) size(*2)) ///
                                ylabel(0 "{bf:0%}" 15 "{bf:15%}", angle(horizontal) labsize(huge)) ytick(0(15)15, notick)  ///
                                xlabel($start "`=year($start)'" $end "`=year($end)'", labsize(vlarge)) xtick($start $end, notick) ///
                                xtitle("") ytitle("") ///
                                plotregion(style(none) istyle(none) margin(zero)) graphregion(style(none)  istyle(none) margin(medium) ) ///
                                xsize(1) ysize(1)  ///
                                name(AK, replace)

graph combine AK ME ///
                WI VT NH ///
                WA ID MT ND MN IL MI NY MA ///
                OR NV WY SD IA IN OH PA NJ CT RI ///
                CA UT CO NE MO KY WV VA MD DE ///
                AZ NM KS AR TN NC SC DC ///
                OK LA MS AL GA ///
                HI TX FL ///
                , cols(11) rows(8) ///
                                holes(2 3 4 5 6 7 8 9 10 ///
                                                12 13 14 15 16 18 19 20 ///
                                                30 33 ///
                                                ///
                                                55 ///
                                                56 65 66 ///
                                                67 68 69 75 76 77 ///
                                                79 80 82 83 84 85 87 88) ///
                                imargin(tiny)  ///
                                ti("{fontface Century Gothic bold:Unemployment by State, `=year($start)'-`=year($end)'}", color(blue)) ///
                                xsize(10) ysize(7.5) name(combined, replace)


