I’ve never been a big VBA coder in Excel, but I’ve always wanted to be a big VBA coder in Excel. It would certainly save me a lot of time, but, well, yeah, I just haven’t learned.
Until now!
Over the past few months, I’ve embarked on a journey to learn some VBA. I’m not trying to become an expert, mind you, just know enough to be dangerous. That’s why I was super excited to create my very own macro to do some simple chart styling using VBA code.
The whole thing started because I wanted to automate a few tasks in my graph creation process. In this case, I wanted to start with gray; I wanted to make all the objects in my chart gray and then start adding color to draw the reader’s attention to a specific line or bar. For purposes of demonstration, let’s just say I wanted to create a slope chart in which–just to start–I’ll make every line gray except one that will be bright green.
Building a slope chart in Excel is pretty easy–create a line chart and then switch the rows and columns (here’s one version). There are two parts of the Excel slope chart that can be time-consuming: adding labels and recoloring the lines, so let’s use VBA to thin the lines and make them all a light gray.
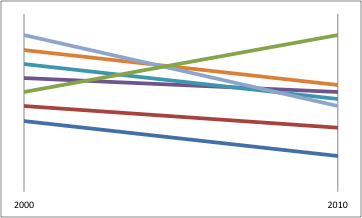
Let’s say, for example, I have this basic slope chart. All of the lines are different colors, but I am going to make all of them gray except for the one series that increases between the two years. I could select each line one at a time and change the color of each, but It’s in this repetitive work where VBA comes in handy.
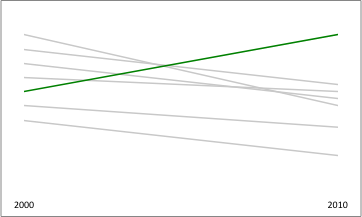
So here’s what I did: A bit of VBA code that loops through all the series on a chart (doesn’t matter what kind of chart) and changes the width of each line to 1.5 and the color to gray. I then manually change the formatting of only one line to bright green (and, no, this chart isn’t done–it needs labels, title, etc.–but not today).
Dim seriescount As Long
.ForeColor.ObjectThemeColor = msoThemeColorText2
.ForeColor.RGB = RGB(217, 217, 217)
.ForeColor.TintAndShade = 0
.ForeColor.Brightness = 0
.Transparency = 0
.Weight = 1.5
End Sub
Cool, eh? (Well, maybe not for people who really know how to code in VBA, but it’s one of my first shots, so I’m pretty pleased.)
The code itself may look complicated, but it’s actually pretty simple: Define two variables, icolor, which will be the counter in the forthcoming For loop; and seriescount, which equals the total number of series in the chart. The For loop then goes through each series–from the first to the last series (remember, seriescount?)–and changes the color to grey (denoted by the RGB code as 217, 217, 217). The Weight command changes the line thickness to 1.5. Obviously, TintandShade, Brightness, and Transparency are additional options that I have chosen not to change.
Want to try it for yourself? Okay, here’s what you do.
- First, you need to activate the Developer tab. In Excel 2010 on Windows, select the File button, then Options. In the resulting menu, select Customize Ribbon and in the right-hand menu under Customize the Ribbon, select the checkbox next to Developer. In Excel 2011 on Mac, select Preferences under the Excel link in the toolbar, then select Ribbon and check the box next to Developer.
- Now that the Developer tab exists in your ribbon, navigate there and select the Macro button. This will open the Macro window. Type the name of the Macro–I named this one OneColorLine, which you can identify because it comes right after the Sub command at the very top.
- Select Create.
- In the VBA Editor, paste the code snippet from above (the code must begin with “Sub OneColorLine()” and end with “End Sub”).
- Go back to Excel and create a simple chart for yourself. Select the chart, select the Macros button again in the Developer tab, select the macro you just created, and hit Run.
- You should now have a chart where all the lines are gray. If you want, you can change the RGB code in the VBA code to any color you want.
As I said, I’m no VBA expert, but there are tons out there if you’d like to learn more. I’m currently enjoying some of the videos at Excel Campus.
If you’d like to learn more about VBA here, please let me know in the comments below and I’ll write a bit more about how to get started, how to save them for use in all of your Excel files, and how to add them as shortcut buttons.
PS Just a funny story about this post. I was using this post as a reference for some new Excel VBA development I’m doing, and one day I couldn’t find the post! I logged back into my WordPress account and sure enough found it–listed in my Drafts folder. I had neglected to publish this post for about a year. Anyways, I hope you found it useful.


