In case you’re not aware, today is March 14, 2014—3/14/14—better known as Pi Day. For some, this is probably an excuse to eat a lot of pie and for others it’s probably an excuse to memorize some number of digits of pi. For some, however, it’s the opportunity to do something about pie charts.
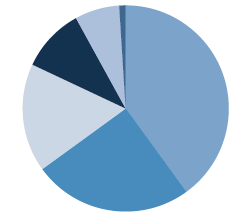
We’re all familiar with the Great Pie Chart Debate (there are too many examples to list here; perhaps my favorite is this one by Stephen Few). On the one hand, people say they love pie charts because they are familiar to the eye, and quickly and easily present the part-to-whole relationship. On the other hand, people argue that our eyes and brains do not communicate in such a way that enables us to accurately discern quantities from pie charts. So, for example, guess the value of the slices in this pie chart (answers at the bottom of the post). My guess is that you got many of them wrong.
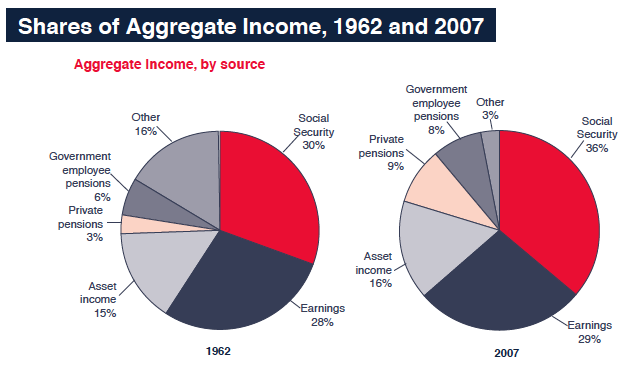
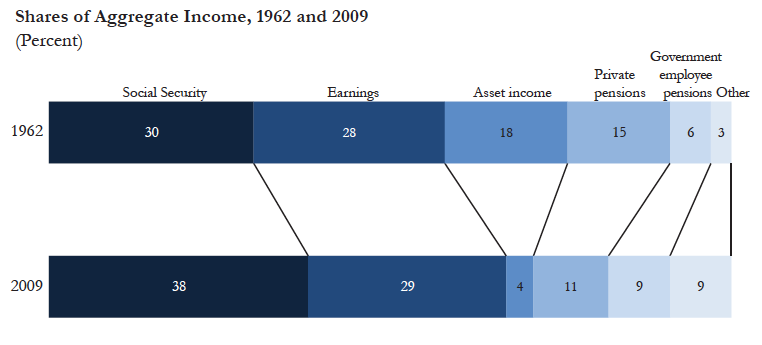
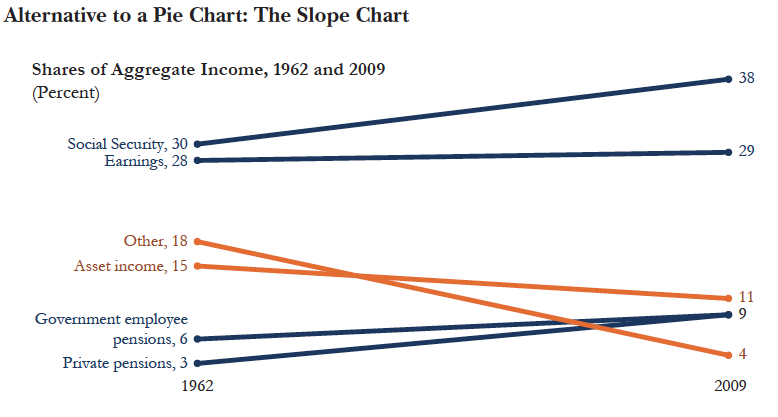
There are a variety of ways to modify pie charts, for example using a bar or column chart. In the case of paired pie charts, you can use stacked bar charts or a slope chart. Here is an example from my recent JEP article:
To counter bad pie charts, Xan Gregg is encouraging people to replace them in your own work or in a public space like Wikipedia with better visualizations. You can leave a comment on Xan’s blog, or here if you like, or tweet with the tag Happy Pi Day! Take action and redesign some pie charts today. Use #onelesspie | http://wp.me/p4cmgj-gB /cc @xanjmp @junkcharts to share your revisions.
If you’re up for editing a Wikipedia entry, here’s a good starting point (there’s apparently a helpful Upload Wizard as well). If you’re not up for a public editing, try to contact the author and encourage them to use a better visualization technique. For fun, I’ve posted a few pie charts on the HelpMeViz site for people to remake and redesign.
If you’re not up for any of it, that’s fine too; just enjoy a slice of pie instead.
Pie chart values, clockwise from the top: 40%, 25%, 17%, 10%, 7%, 1%


Hi admin of this blog, do you allow guest posting ???
Please let me know, i am interested .